
II. Definitions
- Carbohydrates
- Largest class of organic compounds, and contain 3 or more carbons and multiple hydroxyl groups (OH)
- Include starches (Glucose polymers, e.g. glycogen), Disaccharides (e.g. sucrose) and Monosaccharides (e.g. Glucose)
- Most Carbohydrates also contain either an aldehyde group (as with Glucose) or keto group (as with fructose)
- Functions include energy sources, cell signaling, structural molecules and synthesis of Amino Acid, Nucleic Acid, lipid
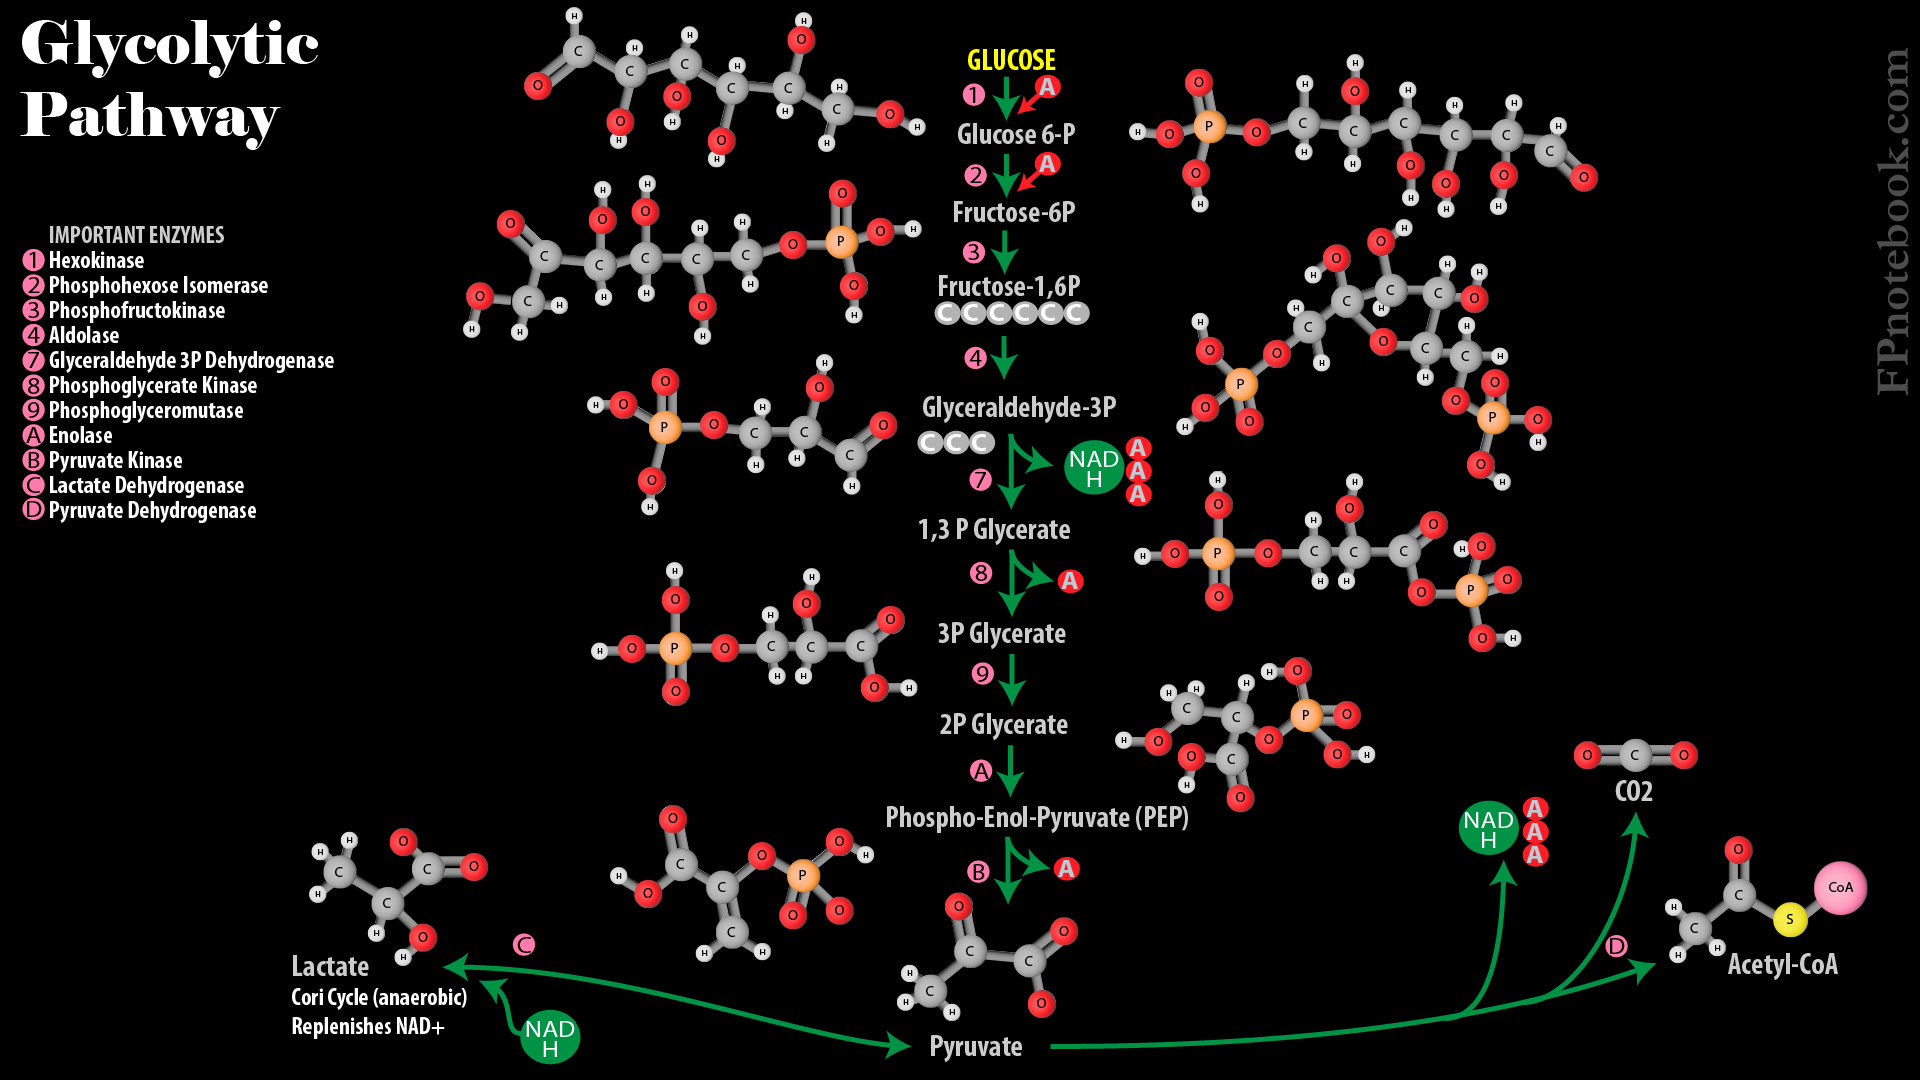
- Glycolysis (Embden-Meyerhoff Pathway, Glycolytic Pathway)
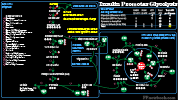
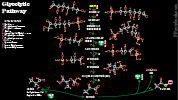
- Catabolic pathway to breakdown Carbohydrates (Glucose, fructose) into pyruvate, without need for oxygen
- Represents only a small part of the overall energy generation from Carbohydrates (2 net ATP and 1 NADH)
- Pyruvate may then be converted to acetyl-CoA (or, when oxygen is unavailable to Lactic Acid)
- Acetyl CoA enters TCA Cycle for energy generation (or is used to form Triglycerides)
- Triggered by Insulin, which lowers Glucose via both Glycolysis as well as increasing glycogen stores
- Glycolysis occurs in the cytoplasm of cells throughout the body
-
Acetyl Coenzyme A (Acetyl CoA)
- Synthesized from Coenzyme A and acetic acid
- Acetyl CoA is substrate in the biosynthesis of Fatty Acids, sterols and Amino Acids
- Serves as entry point of Citric Acid Cycle
- Feeds it substrate from Glucose (and other Carbohydrate), Amino Acid and Fatty Acid catabolism
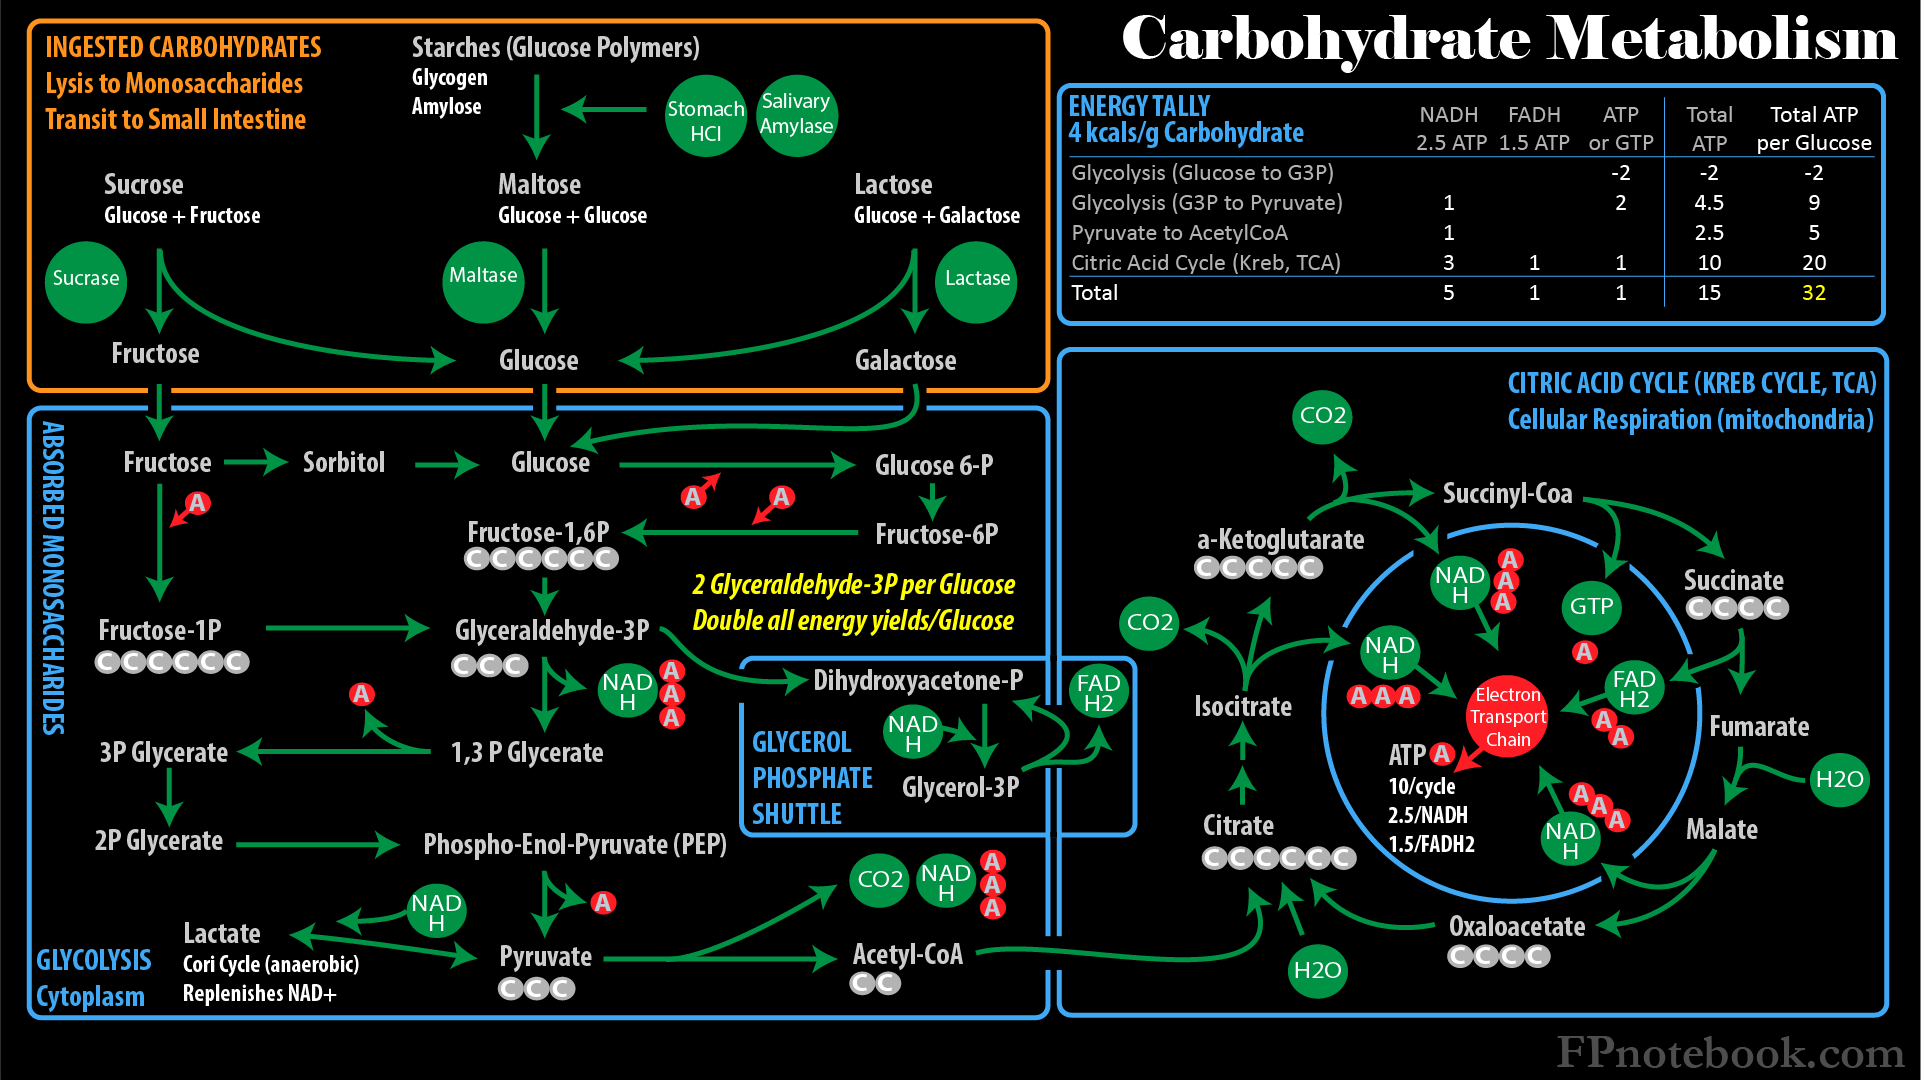
- Citric Acid Cycle (Krebs Cycle, Tricarboxylic Acid Cycle, TCA Cycle)
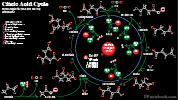
- Universal pathway seen across multicellular organisms, taking place in the mitochondria of humans
- Citric Acid Cycle does not occur in Red Blood Cells (which lack mitochondria)
- Generates energy from Acetyl CoA (3 NADH, 1 FADH, 1 GTP) derived primarily from Glucose
- Intermediate steps include oxaloacetate, isocitrate, a-Ketoglutarate, succinyl-CoA, Succinate, fumarate, malate
- Kreb Cycle intermediates also lead to other pathways (e.g. succinyl-CoA to heme synthesis pathways)
- With decreased Energy Intake or increased Energy Expenditure, Glucose reserves (e.g. glycogen) are exhausted
- In early starvation, Fatty Acids are catabolized to acetyl CoA (and Glycerol), fueling the Krebs Cycle
- With longer starvation, Amino Acids are catabolized to enter the Krebs Cycle
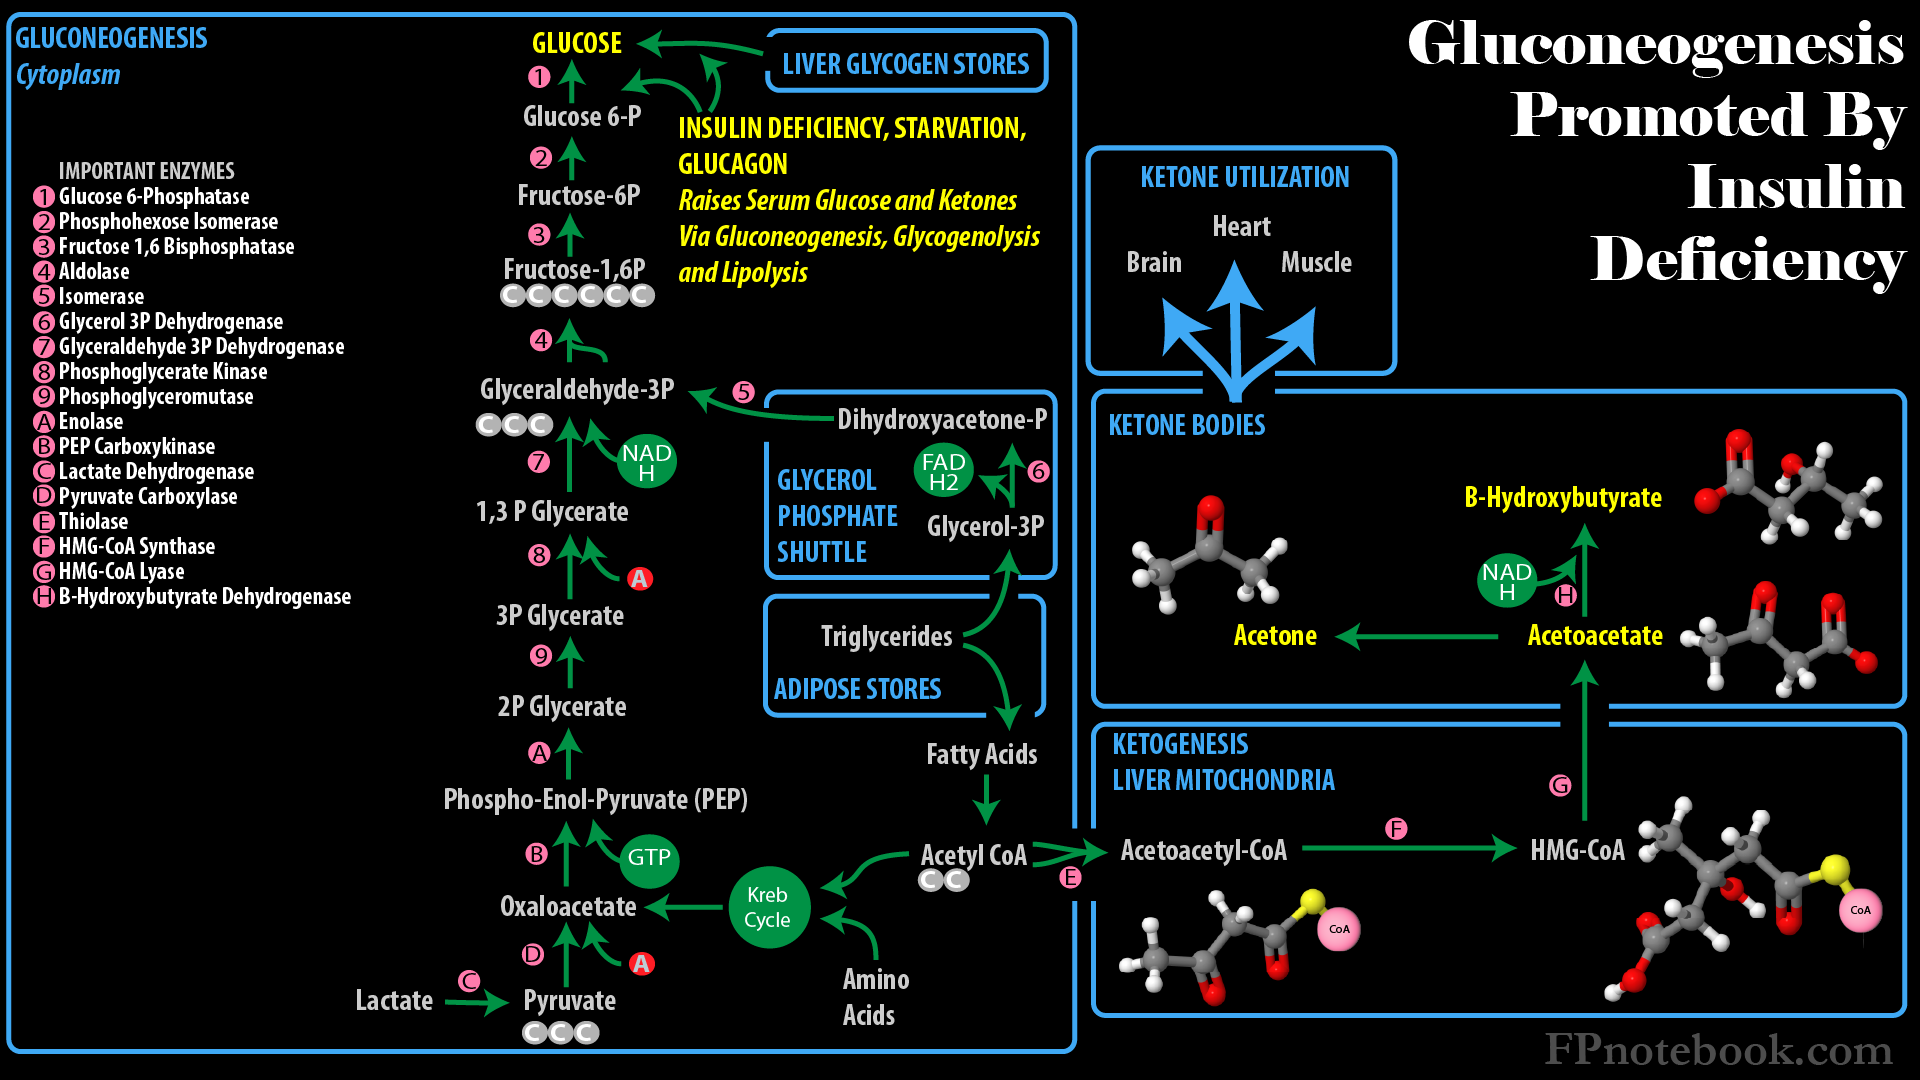
- Gluconeogenesis
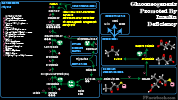
- Pathway forms Glucose from 3- or 4-carbon noncarbohydrate precursors (e.g. pyruvate, Amino Acids and Glycerol)
- Process takes place in the liver (and Kidney) and is triggered when Insulin levels are low and in starvation states
- The same triggers for Gluconeogenesis also trigger Lipolysis and Ketogenesis
- 3 enzymes limit Gluconeogenesis to liver (Pyruvate carboxylase, Fructose Diphosphatase, Glucose 6-Phosphatase)
- Hexose Monophosphate Shunt (HMP Shunt, Pentose Shunt, Pentose Phosphate Path, Phosphogluconate Oxidative Pathway)
- Glucose-6P is converted to a 5 carbon sugar, Ribose-5P, over several steps that generate two NADPH and CO2
- NADPH is a Reducing Agent (donating H+) in cellular reactions
- Active throughout the body (including in RBCs, which lack mitochondria)
- Ribose-5P is used to generate Nucleic Acids (DNA, RNA)
- When Ribose-5P is in excess, it may be converted to Glyceradehyde-3P (Glycolytic Pathway)
- Glucuronidation
- Glucuronic Acid (UDP-Glucuronate) is a water soluble derivative of Glucose, synthesized in the liver
- In Glucuronidation, Glucuronic acid is conjugated to other molecules to facilitate their excretion in urine and bile
- Glucuronidation inactivates and detoxifies various substances (e.g. Bilirubin, bile acids, sex Hormones, Corticosteroids)


III. Physiology: Carbohydrates
-
- Carbohydrates, when burned as energy, generate 4 Kcals/g, and are exhausted in first day of starvation
- Starches and Disaccharides are cleaved into Monosaccharides before intestinal absorption
- Mediated by Stomach acid and Salivary, intestinal and Pancreatic Enzymes (see below)
- Amylase (Saliva, Pancreas) cleaves starches into Glucose and Disaccharides in the Gastrointestinal Tract
- Intestinal wall enzymes cleave Disaccharides: sucrose (sucrase), lactose (lactase) and maltose (maltase)
- Simple Sugars (Glucose, fructose and galactose) are absorbed across the small intestinal epithelial cell walls
- Polysaccharides
- Combination of more than 10 Monosaccharides (Simple Sugars)
- Branched structures (glycogen, amylopectin) allow for efficient building and breakdown of chains
- Multiple end points allows for multiple reactions to occur in parallel, simultaneously
- Starches (Glucose polymers, cleaved by amylase into maltose)
- Structural Polysaccharides
- Cellulose
- Chitin
- Forms the cell wall of fungi, and the exoskeleton of arthropods
- Pectin
- Alpha1,4 linked galacturonic acid polymer found in non-woody cell plant cell walls
- Extracted from citrus fruits, and used as a gelling agent in cooking (e.g. jams)
- Oligosaccharides
- Combination of 3 to 10 Monosaccharides (Simple Sugars)
- Function in cell signaling, cell adhesion and cell recognition
- Dietary Oligosaccharides
- Fructo-Oligosaccharides (chain of fructose molecules, e.g. found in vegetables)
- Galacto-Oligosaccharides (chain of galactose molecules, e.g. found in milk)
- Often a part of glycans, Glycoproteins (linked to Amino Acids) or Glycolipids (linked to lipids)
- See Glycolipids
- N-Linked Oligosaccharides (attached to Asparagine)
- O-Linked Oligosaccharides (linked to Threonine or Serine)
- Glycoprotein
- Synthesis
- Fructose 6-P joins Glutamine to form Glucosamine 6-P (amino sugar)
- Glucosamine 6-P may be transformed into other amino sugars
- Amino sugars are joined with simple Carbohydrates
- Functions
- Glycolipid components
- N-Acetyl Galactosamine (8 carbon amino sugar)
- Sialic Acids (11 carbon amino sugars)
- Cell membrane components
- Antigenic sites (including ABO Blood Type)
- Receptor sites
- Blood Proteins
- Some Hormones (e.g. TSH, FSH)
- Immunoglobulins
- Blood ClottingProteins
- Proteoglycans
- Contain glycosaminoglycans or mucopolysaccharides (predominant Carbohydrate components)
- Glycosaminoglycans are viscous or mucoid (high water consistency)
- Examples include hyaluronic acid, chondroitan sulfate, Heparin
- Glycolipid components
- Synthesis
- Disaccharides
- Monosaccharides (Simple Sugars)
- Monosaccharides are Carbohydrates that cannot be hydrolyzed (lysed with water) to simpler sugars
- Trioses have 3 carbons
- Tetroses have 4 carbons
- Pentoses have 5 carbons
- Hexoses have 6 carbons
- Hexose Examples
- Glucose
- Glucose is the primary cellular fuel stored in glycogen or metabolized via Glycolysis
- Blood Glucose increases via intestinal absorption, gluoconeogenesis or glycogenolysis
- Fructose
- Absorbed from the intestinal tract after sucrose is cleaved into Glucose and fructose
- Fructose may be metabolized to a 3 carbon sugar that enters the Glycolysis pathway
- Also used to generate lipids (via fructose 1P, glyceraldehyde 3P, dihydroxyacetone P)
- Galactose
- Absorbed from the intestinal tract after lactose is cleaved into Glucose and galactose
- Galactose may be converted to Glucose-UDP and then metabolized or stored as Glucose
- Important role in glycans, Glycoproteins (linked to Amino Acids) or Glycolipids (linked to lipids)
- Glucose
- Monosaccharides are Carbohydrates that cannot be hydrolyzed (lysed with water) to simpler sugars
IV. Physiology: Carbohydrate Metabolism
- See Gastrointestinal Metabolism
- Images
- Glycogen Storage
- Excess Blood Glucose is stored in glycogen
- Glucose is converted to Glucose 6P, Glucose 1P and then UDP Glucose
- UDP Glucose is then linked into amylose (non-branched) and finally glycogen (branched)
- Glycogen breakdown occurs when Blood Glucose levels are falling
- Glycogen is branched (1-6 bond) and requires a debranching enzyme during breakdown
- Phosphorylase cleaves off Glucose from non-branched Glucose chains into Glucose-1P
- Phosphorylase stops cleaving Glucose as it approaches 1-6 branches
- Debranching must occur next before Phosphorylase continues on the current chain
- In Muscle, Glucose-1P (and Glucose-6P) is trapped within the cell and utilized for Muscle energy
- In liver, Glucose-1P is converted to Glucose-6P, then via Glucose 6-Phosphatase to Glucose
- Glucose exits the liver cells, and is used systemically by cells for energy
- Other methods of direct glycogen breakdown
- Glycogen breakdown is stimulated by Epinephrine (Muscle Cells) and Glucagon (liver cells)
- Both Epinephrine and Glucagon act at the cell membrane to stimulate adenylate cyclase
- Triggers cyclic AMP which in turn activates phosphorylase and glycogen breakdown
- Excess Blood Glucose is stored in glycogen
-
Blood Glucose
- Released from hepatic stores between meals
- Derived from ingested Carbohydrates
- Postprandial Glucose >20 fold over hepatic release
-
Insulin
- See Insulin
-
General
- Insulin is an anabolic Hormone that is released in the fed state
- Involves triggers mechanisms to move Blood Glucose into storage
- Insulin is produced by pancreatic beta cells
- Insulin release is stimulated by Blood Glucose
- Insulin response to Glucose is linear
- Overall Insulin effects
- Promotes Glucose uptake by liver and Muscle and for storage as glycogen
- Promotes cellular uptake of Amino Acids and Protein synthesis
- Promotes hepatic synthesis of Fatty Acids, VLDL transport to adipose for Triglyceride storage
- Promotes Glycolysis for energy utilization
- Suppresses Gluconeogenesis
- Insulin is an anabolic Hormone that is released in the fed state
- Phase 1 Insulin Release
- Duration: 10 minutes
- Suppresses hepatic Glucose release
- Phase 2 Insulin Release
- Duration: 2 hours
- Controls mealtime Carbohydrates
-
Basal insulin Release
- Low continuous Insulin level
- Covers metabolic needs between meals
-
Glucagon
- See Glucagon
- Endogenous polypeptide Hormone secreted by pancreatic alpha cells
- Opposite effect of Insulin
- While Insulin lowers Serum Glucose (glycogen storage, Glycolysis), Glucagon increases Serum Glucose
- However, both Insulin and Glucagon increase Amino Acid uptake from the liver
- Hypoglycemia effect (primary)
- Inhibitors of Glucagon release
- Hyperglycemia
- Inhibits pancreatic secretion of Glucagon
- GLP1 (Incretin)
- Secreted by Small Bowel
- Stimulates pancreatic beta cells and inhibits Glucagon
- See Incretin Mimetics (used in Type 2 Diabetes Mellitus)
- Hyperglycemia
-
Amino Acid Excess Effect
- Increases pancreatic secretion of Glucagon
- Glucagon stimulates liver uptake of Amino Acids
- Both Insulin and Glucagon increase liver uptake of Amino Acids
-
Glucagon has similar activity to Epinephrine (in terms of Glucose Metabolism)
- Most active in liver (contrast with Epinephrine which is most active in Muscle)
- Both Epinephrine and Glucagon act at the cell membrane to stimulate adenylate cyclase
- Triggers cyclic AMP which in turn activates phosphorylase and glycogen breakdown
- Glucagon also acts at Catecholamine-independent receptors on cardiac cells
- Increases intracellular Calcium in cardiac cells
- Increases myocardial contractions
-
Epinephrine
- See Epinephrine
-
Epinephrine has alpha-adrenergic effects (esp. alpha-2) specific to metabolism
- Increases Serum Glucose (Gluconeogenesis, Glycogenolysis)
- Increases Fatty Acids (Fat cell lipolysis of Triglycerides)
- Similar activity to Glucagon (in terms of Glucose Metabolism)
- Both Epinephrine and Glucagon act at the cell membrane to stimulate adenylate cyclase
- Triggers cyclic AMP which in turn activates phosphorylase and glycogen breakdown
- Most of Epinephrine's primary effects are cardiopulmonary
- Alpha Adrenergic Agonist Effects
- Vasoconstriction (increased Systemic Vascular Resistance and Blood Pressure)
- Increases Vital Organ Perfusion (myocardial and cerebral perfusion)
- Decreases Non-Vital Organ Perfusion
- Decreases splanchnic and intestinal perfusion
- Decreases renal and skin perfusion
- Beta Adrenergic Agonist effects (Under 0.3 ug/kg/min)
- Increases myocardial contractility and Heart Rate
- Relaxes Bronchial Smooth Muscle (bronchodilation)
- Alpha Adrenergic Agonist Effects
-
Growth Hormone
- See Growth Hormone
- Polypeptide produced in the acidophil cells of the anterior pituitary
-
Hypothalamus controls release when triggered by Hypoglycemia, decreased Amino Acids
- Growth Hormone Releasing Hormone (GHRH) stimulates release
- Somatostatin inhibits release
- Biochemistry
- Liver converts Growth Hormone to Insulin-like growth factor (IGF-1) and stimulates other growth factors
- Growth Hormone is a precursor to Testosterone
- Positive Function (stimulates or promotes the following activities)
- Bone and cartilage growth
- Protein synthesis
- Promotes Fatty Acid use as fuel instead of Glucose
- Lipid catabolism to Fatty Acids (for energy source)
- Hyperglycemia (from decreased cell utilization of Glucose) resulting in an increase of glycogen stores
-
Cortisol
- See Cortisol
- Cortisol is synthesized in the Adrenal Cortex, derived from Cholesterol (See Cortisol Synthesis_
- Cortisol secretion is stimulated by Adrenocorticotropic Hormone (ACTH) in response to stress (See Pituitary Gland)
-
Cortisol functionality
- Mobilizes available energy sources (Glucose, fats, Amino Acids)
- Increases Serum Glucose by stimulating liver Gluconeogenesis and glycogenolysis
- Increases serum Fatty Acids by promoting lipolysis of adipose Triglyceride stores
- Increases blood Amino Acids by breaking down Proteins (outside liver)
- Antiinflammatory activity
- Inhibit Histamine release
- Inhibit Lymphocyte production
- Stabilize MacrophageLysosomes
- Increases gastric acid production
- Mobilizes available energy sources (Glucose, fats, Amino Acids)
- Incretin
V. Pathophysiology: Lactic Acid
- See Lactic Acid
-
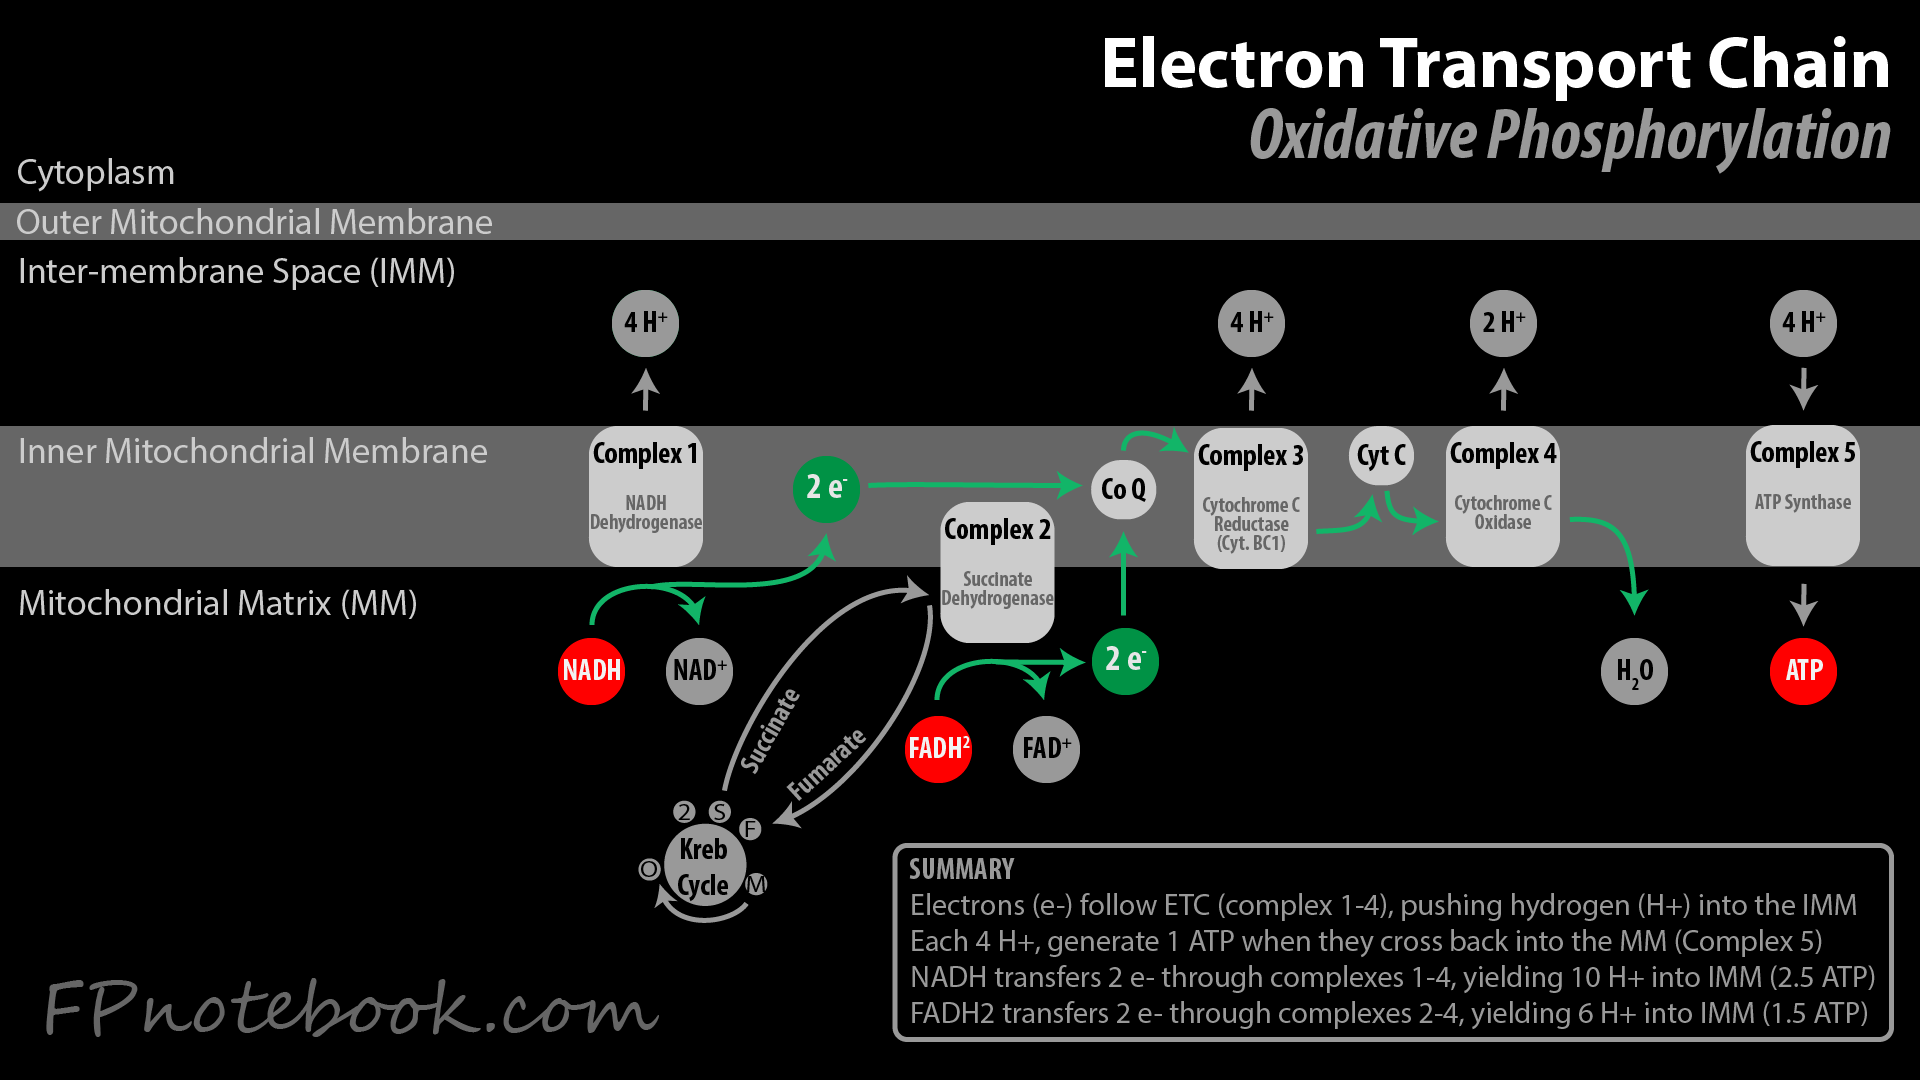
Lactic Acid is generated when oxygen is unavailable to allow for Krebs Cycle related Oxidative Phosphorylation
- Occurs with both skeletal Muscle anaerobic metabolism as well as other physiologic stress (e.g. Sepsis)
- Lactic Acid may also be generated during aerobic conditions
- Glycolysis generates 7 net ATP/Glucose (compared with 25 for Kreb Cycle) and does not require oxygen
- However, Glycolysis does use NAD+ (for glyceraldehyde 3-P to 1,3P2-glycerate)
- NAD+ is typically replenished in the Krebs Cycle related Oxidative Phosphorylation
- When oxygen is unavailable, pyruvate is metabolized to Lactic Acid, regenerating NAD+
-
Lactic Acid conversion back to Glucose (Gluconeogenesis) requires several additional steps
- Muscle Cells release generated Lactic Acid
- Lactate may be directly utilized by the Heart (up to 60% of energy demands) and brain (up to 25% of energy demands)
- Lactic Acid is transported via systemic circulation to liver and Kidney
- Liver (70-75%) and Kidney (25-30%) cells perform lactate metabolism (Gluconeogenesis)
- Three Enzymes required for Gluconeogenesis from Lactic Acid are only in cells of the liver and Kidney
- Pyruvate carboxylase
- Fructose Diphosphatase
- Glucose 6-Phosphatase
VI. Pathophysiology: Insulin
-
Insulin excess
- See Hypoglcemia
- See Insulin Shock (Insulin Overdose, Insulin Reaction)
-
Insulin at low levels or deficiency
- Causes
- Low Insulin due to Diabetes Mellitus
- In Type I Diabetes, Insulin deficiency is key
- In Type II Diabetes, Insulin Resistance is key initially, but later Insulin deficiency results
- Low Insulin as a normal physiologic response to Hypoglycemia
- Low Insulin due to Diabetes Mellitus
- Low Insulin effects
- Gluconeogenesis and Glycogenolysis results in Hyperglycemia
- Lipolysis (Triglyceride breakdown to Fatty Acids)
- Further lysed into acetyl coA to be utilized in the Kreb Cycle (TCA Cycle, Citric Acid Cycle)
- Other Fatty Acids are diverted to Ketogenesis (Ketone formation)
- Fatty Acids also form excess Cholesterol, Triglycerides within VLDL with increasing atherosclerosis
- Causes
VII. Pathophysiology: Type I Diabetes
- See Type I Diabetes Mellitus
- See Maturity Onset Diabetes of the Young
- Deficiency of Insulin, with multiple underlying mechanisms
- Type 1A
- Environmental and genetic factors
- HLA-DR4 association
- Cell mediated pancreatic beta cell destruction
- Type 1B (uncommon)
- Primary Autoimmune Condition
- Associated with other Autoimmune Conditions
- HLA-DR3 association
- Incidence highest in 30-50 year olds
- Secondary Diabetes Mellitus
VIII. Pathophysiology: Type II Diabetes Mellitus
- See Type II Diabetes Mellitus
- Loss of Glucose sensitivity (see above)
- Insulin production by beta cell
- Impaired Incretin action
- Incretins manage postprandial Glucose levels
- Incretin released from GI Tract following meals
- Endogenous Incretin effects
- Progressive Incretin reduced activity
- Glucagon-Like Peptide 1 (GLP-1) activity decreases
- Incretins manage postprandial Glucose levels
- Medications
- Increase Insulin sensitivity
- Stimulate Insulin release from beta cells
- Meglitinides (act on phase 1 release)
- Sulfonylureas (act on phase 2 release)
- Replace Insulin
- See Insulin
- Increase Incretin levels (GLP-1)
IX. References
- Goldberg (2014) Clinical Physiology, Medmasters, Miami, p. 120-46
- Goldberg (2001) Clinical Biochemistry, Medmasters, Miami, p. 13-16
- Guyton and Hall (2006) Medical Physiology, 7th Ed, Elsevier Saunders, Philadelphia, p. 829-58