
II. Anatomy: Ventilation and Perfusion
- Images
- Human adult lung is composed of more than 20 generations of branching airways that lead to 300 million alveoli
- Cellular Respiration (Glycolysis)
- Balance of oxygen utilization (and carbon dioxide production) is driven by cellular energy needs
- Cellular ADP, when in excess, drives an increase in Glycolysis to generate ATP
- ATP, when in excess, provides negative feedback to suppress Glycolysis
- Ventilation (V)
- When filled with a normal Tidal Volume breath, the Bronchi and alveoli contain ~450 ml of inspired air
- Bronchi and Bronchioles do not participate in gas exchange, are considered Anatomic Dead Space (~150 ml)
- Alveoli are the functional units of gas exchange and contain a total of ~300 ml of inspired air in an adult
- Total Lung Gas Exchange surface area is 145 m^2 (roughly the size of a tennis court)
- Based on alveolar diameter range 75-300 µm
- Total Lung Gas Exchange surface area is 145 m^2 (roughly the size of a tennis court)
- Each minute, an average male adult breathing at a rate of 16/min
- Total ventilation (Ve or expired ventilation): 7200 ml/min
- Alveolar ventilation (Va): 4800 ml
- Perfusion (Q)
- Pulmonary artery gives rise to branches that parallel the Bronchi to the capillaries surrounding each alveolus
- Entire Stroke Volume from the right heart passes through lung circulation with each beat
- Cardiac Output adult male: ~4800 ml/min
- Cardiac Output then roughly has the same volume as alveolar ventilation (V/Q ratio)
- Unlike the lung, perfusion has no dead space
- All blood must circulate from artery to alveolar capillary to vein to reach left atrium
- Contrast to ventilation in which inspired air and expired air share the same pathway
- Ventilation and Perfusion in General
- Ventilation is typically greater in the upper lung fields
- Ventilation to lung units that receive less perfusion is wasted
- Perfusion is typically greater in the dependent lung (lung base if upright) due to gravity
- Lung perfusion prioritizes well ventilated lung regions
- Localized lung hypoxia Vasoconstricts pulmonary vessels, resulting in decreased perfusion
- Contrast with non-lung tissue localized Hypoxia which triggers vasodilation (increased perfusion)
- Pulmonary Vasoconstriction prevents wasted perfusion to under-ventilated lung regions
- Pulmonary Hypertension results in a chronically and diffusely hypoxic lung
- Localized lung hypoxia Vasoconstricts pulmonary vessels, resulting in decreased perfusion
- Ventilation is typically greater in the upper lung fields
- Ventilation-Perfusion Matching in the Normal Lung
- Each alveolus receives roughly an equal amount of ventilation and perfusion (V/Q=1)
- Since blood is heavier than air, gravity has a minor effect on lung perfusion
- Due to gravity, perfusion to lungs is greater to dependent regions (lung base when patient upright)
- Lung base (when upright) has V/Q<1
- Lung apex (when upright) has V/Q >1
- Ventilation-Perfusion Mismatch in the Abnormal Lung
- Abnormal lungs may have dramatically mismatched ventilation to perfusion
- Under ventilated alveoli (V/Q<1) waste perfusion with blood returning to the left heart under-saturated with oxygen
- Over-ventilated alveoli (V/Q>1) waste ventilation as blood becomes saturated with oxygen at a fixed maximum
- Physiologic Dead Space is the total excess ventilation to over-ventilated alveoli (V/Q>1)
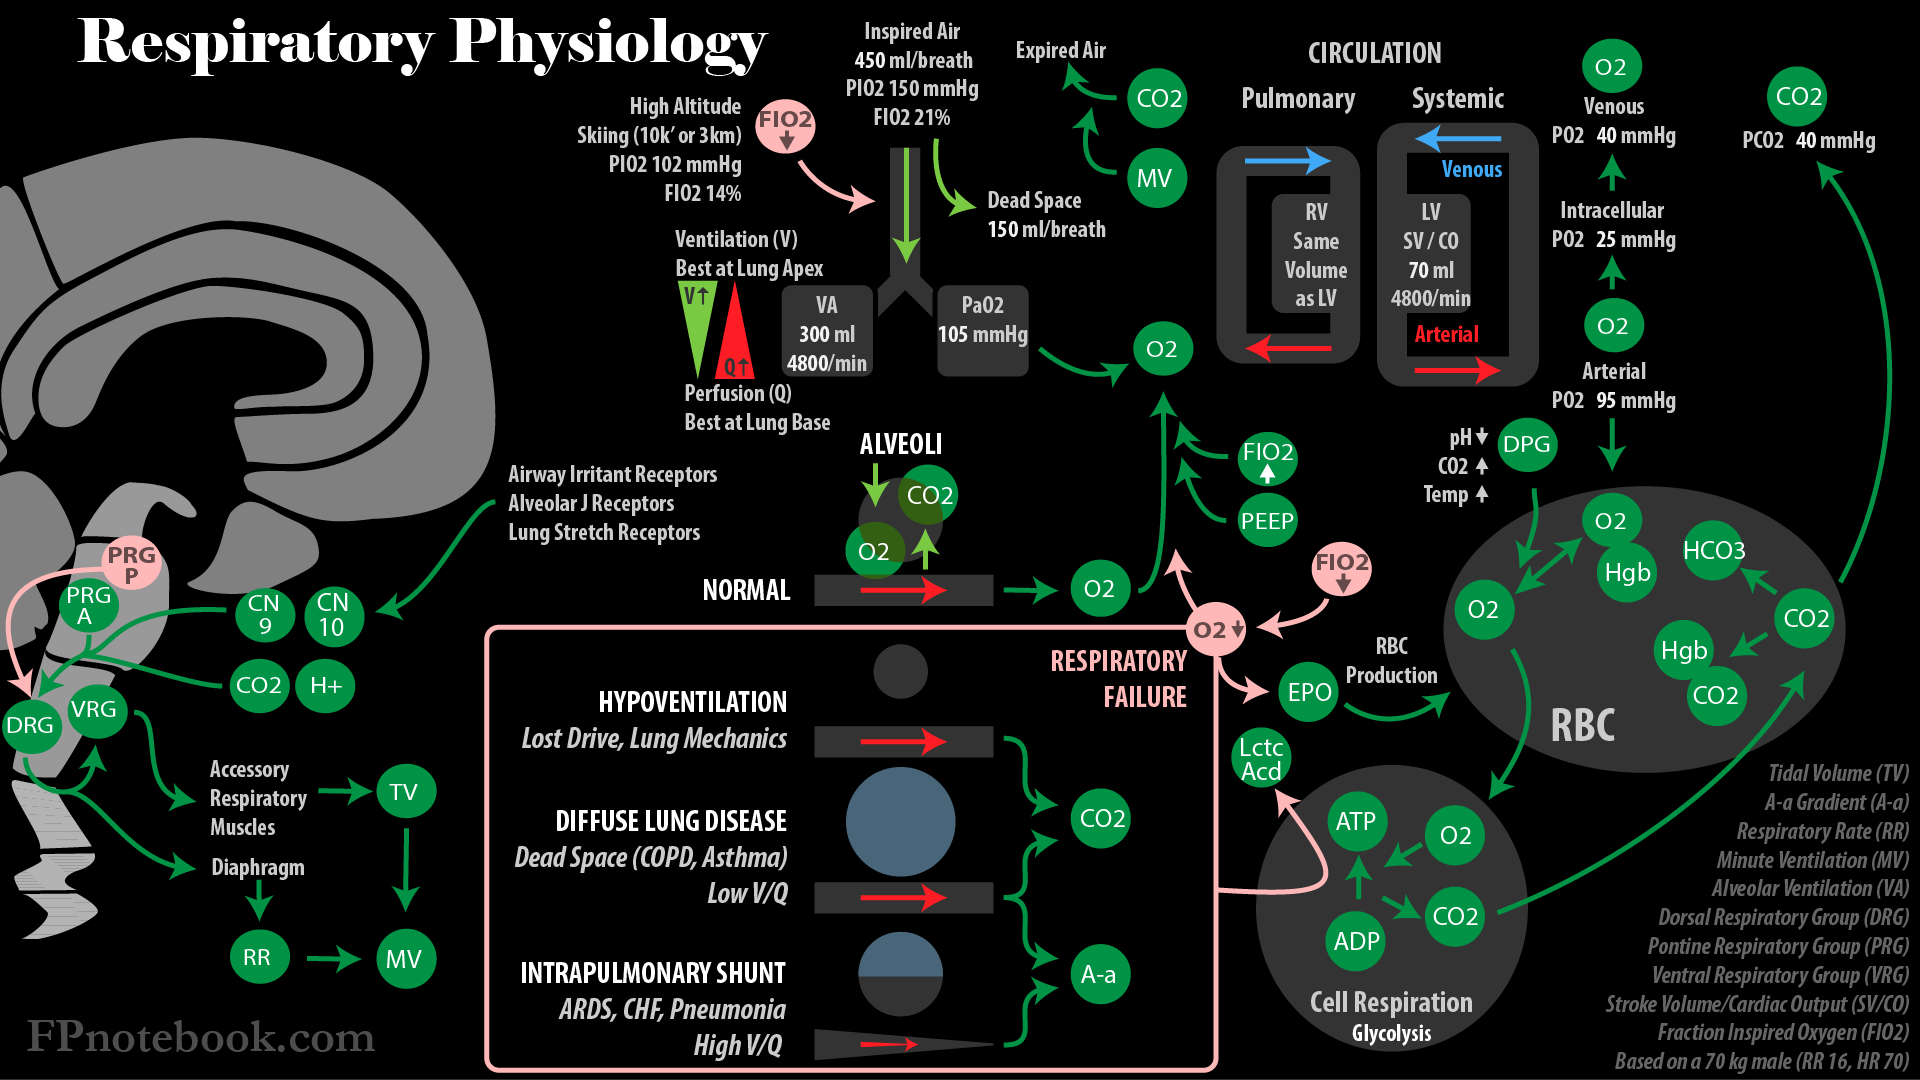
III. Physiology: Gas Exchange - Oxygen
- See Oxygen Saturation Curve (Oxyhemoglobin Dissociation Curve)
- See PaO2 (Arterial Oxygen Partial Pressure)
- Background
- Oxygen is an atmospheric gas required by all cells to burn fuel (esp. Glucose) aerobically
- Oxygen diffuses into pulmonary capillaries from inspired air within lung alveoli
- Most oxygen (97%) is transported in circulation bound to Hemoglobin
- Each molecule of Hemoglobin binds four O2 molecules (one for each iron molecule)
- Each gram of Hemoglobin carries 1.39 ml Oxygen
- At Hemoglobin 15 g/dl, blood carries 20.8 ml Hgb-bound oxygen when fully saturated (PaO2 100 mmHg)
- Oxygen is poorly soluble in plasma
- Oxygen is transported to tissues, where it is required to sustain core cellular functions
- Tissue oxygenation improves with Supplemental Oxygen, increased Hemoglobin And Cardiac Output
- Supplemental Oxygen improves Hypoxia in decreased gas exchange (e.g. V/Q mismatch, high altitude)
- Severe Anemia responds poorly to Supplemental Oxygen until oxygen carrying improves (e.g. transfusion)
-
Minute Ventilation (Respiratory Rate and Tidal Volume) does not significantly affect oxygenation
- However, decreased dead space and Atelectasis (e.g. PEEP) does improve oxygenation
- Lung regions with normal gas exchange cannot compensate for lung regions with poor gas exchange
- Normal lung regions cannot hyperoxygenate blood once it is fully oxygen saturated
- Oyxgen is only a minor mediator of respiration under normal conditions
- However, in severe Hypoxia (pO2 30-60 mmHg) oxygen becomes an important respiratory trigger
- Normal oxygen pressures drop from atmospheric levels to intracellular levels
- Atmospheric oxygen: 150-160 mmHg
- PiO2 = (760 mmHg - 47 mmHg) * 0.21 = 150 mmHg
- Where Atmospheric Pressure at sea level = 760 mmHg
- Where Fully saturated Water Vapor Pressure = 47 mmHg
- Where FiO2 (fraction of inspired air that is Oxygen) = 0.21
- Most of remaining inspired air is Nitrogen (0.78)
- Inspired Oxygen Pressure decreases with increased altitude and decreased barometric pressure
- Alveolar capillary oxygen (PAO2): 105 mmHg
- Alveolar oxygen pressure is reduced from that in inspired air due to PCO2 within the alveolus
- PAO2 = PiO2 - PaCO2/0.8
- where PAO2 is the alveolar oxygen Partial Pressure or tension
- where PiO2 is the inspired oxygen Partial Pressure (calculated above)
- where PaCO2 is the arterial CO2 Partial Pressure (near identical surrogate for alveolar CO2)
- where 0.8 is the Respiratory Quotient (RQ)
- RQ is the CO2 generated per 1 ml of oxygen utilized in cellular respiration
- RQ is 0.7 ml (fat fuel) to 1.0 ml (Carbohydrate fuel)
- Arterial oxygen (PaO2): 95 mmHg
- Arterial Oxygen Pressure (PaO2) is typically <10 mmHg below Alveolar Oxygen Pressure (PAO2)
- Known as Alveolar-Arterial Oxygen Tension Difference (A-a Gradient)
- A-a Gradient increases with age (ultimately to 20 mmHg at 80 years old)
- Peripheral interstitial oxygen: 40 mmHg
- Peripheral intracellular oxygen: 25 mmHg
- Peripheral cells need only PO2 of 2 mmHg for adequate functioning
- See Cellular Respiration described above
- Venous oxygen: 40 mmHg
- Atmospheric oxygen: 150-160 mmHg
- Low arterial oxygen (PaO2)
- Hypoventilation (e.g. Bellows Failure)
- Increased CO2 (PACO2 and PaCO2) accounts for decreased Partial Pressure of oxygen (PAO2 and PaO2)
- Normal Alveolar-Arterial Oxygen Tension Difference (A-a Gradient)
- Low inspired oxygen (FIO2)
- Low Oxygen Partial Pressure or tension within inspired air and alveoli
- Examples include low Fraction of Inspired Oxygen at High Altitude
- Normal Alveolar-Arterial Oxygen Tension Difference (A-a Gradient)
- Venous admixture (Low V/Q, most common)
- Decreased ventilation to segments of lung impaired by acute or chronic lung disorders
- Examples include Asthma and COPD
- Lower V/Q ratios are correlated with lower PaO2 (approaching venous oxygen levels)
- Decreased Alveolar-Arterial Oxygen Tension Difference (A-a Gradient)
- Hypoxia (low PaO2) improves with Supplemental Oxygen
- Right to Left Shunt (V/Q=0)
- As with right to left intracardiac shunts, venous blood passing through unventilated lung is not oxygenated
- Examples include Lobar Pneumonia or Pulmonary Edema
- Decreased Alveolar-Arterial Oxygen Tension Difference (A-a Gradient)
- Hypoxia (low PaO2) does NOT significantly improve with Supplemental Oxygen
- Decreased Alveolar-Capillary Diffusion (not a significant factor at rest)
- Decreased diffusion across alveoli does not cause significant Hypoxia at rest
- RBCs transiting alveolar capillaries have a full second in contact with alveoli to allow for delayed diffusion
- However, with increased Heart Rate (e.g. exertion), impaired diffusion may result in Hypoxia
- Low Mixed Venous Oxygen Tension (PvO2)
- Low PvO2 is not significant in normal lungs, but compounds Hypoxemia when lung disorders are present
- Significant V/Q mismatch or shunt starting with low PvO2 will exit the lung with lower PaO2
- Examples include shock states
- Improves with increasing Cardiac Output (e.g. Intravenous Fluids or Blood Transfusion in Hypovolemic Shock)
- Hypoventilation (e.g. Bellows Failure)
IV. Physiology: Gas Exchange - Carbon Dioxide
- See PaCO2
- See Capnography
- Carbon Dioxide forms as a volatile waste product during cellular respiration (Glycolysis)
- Normal CO2 production at rest: 200 ml/min
- Assumes Minute Ventilation (MV) 6 L/min (Alveolar Ventilation 4 L/min)
- Each MV liter costs 1 ml of oxygen, and generates 0.7 to 1.0 ml CO2 (depending on RQ)
- Respiratory Quotient (RQ) varies from 0.7 ml (fat fuel) to 1.0 ml (Carbohydrate fuel)
- Normal lungs at rest only generate 6 ml/min CO2
- Most CO2 production is from non-respiratory cellular function
- Heavy Exercise: 4000 ml/min
- Increased Minute Ventilation (6 to 100 L) with Exercise prevents hypercarbia (see below)
- Normal CO2 production at rest: 200 ml/min
- Carbon Dioxide (CO2) diffuses into Red Blood Cells within capillaries
- Carbon dioxide may also dissolve in plasma, but represents <5% of CO2 in blood
- Most plasma CO2 enters Red Blood Cell
- CO2 is rapidly converted to other forms in RBC (bicarbonate, Carbaminohemoglobin)
- CO2 tension within Red Blood Cell therefore remains low
- Gradient from plasma into Red Blood Cell is maintained
- Most carbon dioxide (70-85%) is converted (hydrated) to biocarbonate in the Red Blood Cell
- Facilitated by enzyme carbonic anhydrase found in Red Blood Cells (not in plasma)
- Carbonic anhydrase speeds rate of reaction by 10,000 fold
- Carbaminohemoglobin (CO2 bound to Hemoglobin) accounts for 10-25% of CO2 carried in blood
- Carbamino Proteins bind CO2 at the nitrogen binding site and release H+
- Oxygen saturated Hemoglobin binds CO2 less than when desaturated (Haldane Effect)
- In peripheral tissue, Hemoglobin releases oxygen, and better binds CO2
- In lung, oxygen saturates Hemoglobin, and releases CO2 for excretion
- Hydration of Carbon Dioxide within Red Blood Cells, forming bicarbonate
- Red Blood Cell (RBC) carbonic anhydrase catalyzes conversion of CO2 to carbonic acid (H2CO3)
- H2O + CO2 <=> H2CO3
- Carbonic Acid (H2CO3) dissociates into Bicarbonate (HCO3-) and Hydrogen (H+)
- H2CO3 <=> HCO3- + H+
- Red Blood Cell (RBC) carbonic anhydrase catalyzes conversion of CO2 to carbonic acid (H2CO3)
- Bicarbonate exits Red Blood Cell and is transported via venous circulation to lungs for expiration
- Hydrogen Ion remaining in the Red Blood Cell binds Hemoglobin (buffers Hydrogen Ion)
- Hydrogen binding alters Hemoglobin molecule making it less oxygen avid (Bohr Effect)
- Hydrogen binding favors RBC Hemoglobin unloading of oxygen in peripheral tissue
- In the lungs, the process reverses
- CO2 is excreted and Hemoglobin is less hydrogen bound
- Hemoglobin molecule assumes unbound configuration and becomes more oxygen avid
- Chloride (Cl-) enters Red Blood Cells to offset the loss of bicarbonates negative charge
- Results in a "chloride shift" into RBCs within venous blood compared with arterial blood
- Hydrogen Ion remaining in the Red Blood Cell binds Hemoglobin (buffers Hydrogen Ion)
- Lung expiration
- CO2, in all its forms (bicarbonate, carbaminohemoglobin and CO2), is excreted via expiration
- Minute Ventilation (Respiratory Rate x Tidal Volume) controls pCO2
- CO2 diffuses easily across alveolar membranes (20 fold faster than oxygen)
- Lung excretes more than 15,000 mEq of volatile acid as CO2 per day
- Within minutes of apnea onset, Respiratory Acidosis may be lethal
- Contrast with the 100 mEq of acid that is renally excreted per day
- Unlike in hypercarbic Respiratory Failure, Hemodialysis may be performed every 2-3 days
- Carbon Dioxide (and H+, pH) is the primary mediator of respiration under normal conditions
- See Respiratory Control below
- Changes in PaCO2 is met by rapid compensatory change in alveolar ventilation
- PaCO2 = k x VCO2/Va
- where PaCO2 is arterial Partial Pressure of CO2
- where correction factor (k) = 0.863
- where VCO2 is CO2 production (in ml/min STPD)
- where Va is alveolar ventilation (in l/min BTPS)
- Va = Ve x (1- Vd/Vt)
- where Ve = Total Ventilation
- where Vd/Vt = Fraction of Physiologic Dead Space
- Doubling alveolar ventilation results in half the PaCO2
- Increasing Respiratory Rate from 12 to 24, decreases PaCO2 from 40 to 20 mmHg
- Further increases in ventilation result in diminishing PaCO2 changes (PaCO2 does not drop <10-20 mmHg)
- However, at very low Ventilatory rates, small increases in ventilation result in large decreases in PaCO2
- Cutting by half the alveolar ventilation results in double the PaCO2
- Decreasing Respiratory Rate from 12 to 6, increases PaCO2 from 40 to 80 mmHg
- Normal carbon dioxide pressures change little throughout circulation
- Atmospheric pCO2: 0.3 mmHg
- Alveolar and Arterial pCO2: 40 mmHg (48 ml per 100 ml blood)
- Curvilinear relationship between CO2 content to CO2 pressure (or tension)
- Large changes in pressure or tension result in small changes in CO2 content
- Allows for significant compensation for CO2 pressure changes
- Hyperventilation pCO2: 10 mmHg (30 ml per 100 ml blood)
- Apnea pCO2: 80 mmHg (70 ml per 100 ml blood)
- Curvilinear relationship between CO2 content to CO2 pressure (or tension)
- Interstitial, Intracellular and Venous pCO2: 45 mmHg (54 ml per 100 ml blood)
- Increased arterial carbon dioxide (PaCO2)
- The 3 causes of high PaCO2 relate to the formula PaCO2= k x VCO2/Va (see above)
- where Alveolar Ventilation (Va) = Ve x (1- Vd/Vt)
- Total ventilation (Ve) decreased
- Apnea
- Airway obstruction
- Bellows Failure
- Fraction of Physiologic Dead Space (Vd/Vt) increased
- Wasted ventilation (high Physiologic Dead Space) must be compensated by increasing total ventilation (Ve)
- Increased total ventilation (Ve) may come at a high cost of respiratory workload with inadequate results
- CO2 Production (VCO2) increased
- Increased respiratory workload may increase CO2 production significantly
- Normal respiration may generate 1 ml CO2 per 1 liter minute respiration
- Severe COPD or Asthma may generate 10-20 ml CO2 per 1 liter minute respiration
- Total ventilation (Ve) increased to 20 liters/min may cost 400 ml/min CO2 from respiration alone
- Normal, resting CO2 production is only 200 ml/min for the entire body
- Excreting high CO2 loads (high acid load) is unsustainable with high dead space and work of breathing
- The 3 causes of high PaCO2 relate to the formula PaCO2= k x VCO2/Va (see above)
V. Physiology: Respiratory Control
- See Acute Respiratory Failure
-
Ventilatory response to Respiratory Control assumes ability to perform respiratory effort
- See respiratory Muscle activity below
- Bellows Failure (Hypoxemia and hypercarbia) in Acute Respiratory Failure results from inspiratory effort failure
- Neurologic Mediators: Respiratory Center (Brainstem)
- Medulla Oblongata
- Dorsal Respiratory Group (DRG, solitary nucleus)
- Ventral Respiratory Group (VRG)
- Composed of four Neuron groups including Nucleus Ambiguous
- Active in inspiration and expiration during forceful breathing
- Negative feedback loops to Apneustic Center (pons)
- Pons
- Pneumotaxic Center (parabrachial nucleii)
- Controls Breathing Rate and pattern by limiting inspiration, Tidal Volume and Respiratory Rate
- Acts in a cyclical manner, to inhibit phrenic Nerve Impulses during expiration ("switch-off")
- Apneustic Center
- Stimulates inspiration centers in the Medulla dorsal respiratory group
- Pneumotaxic Center (parabrachial nucleii)
- Medulla Oblongata
- Neurologic Mediators: Non-Chemoreceptor Afferent Nerves
- Afferent signals are passed to Brainstem from Vagus Nerve and spinal nerves
- Respiratory Rate increases in response to non-Chemoreceptor afferent triggers
- Contrast with the increased Tidal Volume response to increased pCO2
- Vagus Nerve afferent nerves (airway, lung parenchyma, pulmonary vasculature)
- Irritant receptors (e.g. noxious gas, Airway Foreign Body)
- Alveolar J Receptors (e.g. congestion in CHF, cell proliferation in intersitial lung disease)
- Stretch Receptors (pleura, lung)
- Spinal afferent nerves (chest wall, respiratory Muscles)
- Afferent signals are passed to Brainstem from Vagus Nerve and spinal nerves
- Neurologic Mediators: Phrenic Nerve
- Stimulated by Brainstem respiratory centers
- Originates in C3, C4, and C5 spinal nerves, exiting the ventral roots and initially following the internal Jugular Veins
- Innervates the diaphragmatic Muscles, which on contraction, result in inspiration
- Also receives sensory input from the Pericardium, mediastinal pleura, diaphragmatic peritoneum
- Responsible for referred pain to Shoulder and neck from Gall Bladder and heart
- Chemical Mediators of Increased Respiratory Effort
- Increased Carbon Dioxide (pCO2) and Acidosis (increased H+, decreased pH) stimulate increased respiration
- Cerebrospinal fluid pH is immediately influenced by PaCO2 changes
- Central Chemoreceptors on ventrolateral Medulla detect change in pH
- Peripheral Chemoreceptors (carotid bodies) are also Blood pH sensitive, but weaker (25%)
- Even small changes in PaCO2 increase has a near immediate response with increased ventilation
- Even a PaCO2 increase of 1 mmHg, results in an increase in Minute Ventilation of 2-5 Liters
- Increased Tidal Volume accounts for most of the increased Minute Ventilation
- Directly stimulate Brainstem respiratory centers (primary affect)
- Affect aortic and carotid bodies which stimulate Brainstem respiratory centers (CN 9, CN 10)
- Increased respiratory effort due to increased CO2 typically does not cause a Sensation of Dyspnea
- Even a PaCO2 increase of 1 mmHg, results in an increase in Minute Ventilation of 2-5 Liters
- When Hypoxia is absent, increased CO2 is the primary stimulator of increased respiration
- Corrects hypercapnia as well as acidosis
- Concurrent Hypoxia and hypercarbia enhances respiratory response to both O2 and CO2
- Respiratory response to hypercapnia is greater with Hypoxemia
- Respiratory response to Hypoxemia is greater with hypercarbia (even when PaO2 65-70 mmHg)
- The reverse is also true, as excessive Supplemental Oxygen may blunt CO2 response
- Decreased Oxygen (pO2)
- Affect aortic (CN 10) and carotid bodies (CN 9) which stimulate Brainstem respiratory centers
- Oxygen (pO2) is a weak trigger for respiration compared with pCO2 under normal conditions
- Response to pO2 is primitive in contrast to the finely calibrated response to pCO2
- Conditions in which low pO2 (Hypoxia) becomes an important trigger for respiration
- Significant Hypoxia (pO2 <50-55 mmHg)
- High altitude before acclimitization (lower oxygen concentration in inspired air)
- Hypoxemic Respiratory Failure (or physiologic right to left shunting, e.g. ARDS)
- Increased Carbon Dioxide (pCO2) and Acidosis (increased H+, decreased pH) stimulate increased respiration
- Other Mediators of Respiratory Effort
- Exercise
- Direct stimulation from motor cortex, while simultaneously stimulating muscular activity
- Hering-Breuer Inflation Reflex
- Bronchial stretch receptors limit hyperinflation while increasing Respiratory Rate
- Atmospheric Pressure
- Diving (higher atmospheric pressure)
- See Decompression Sickness (Nitrogen Toxicity)
- Diving concentrates gases into a smaller space at higher atmospheric pressure
- More nitrogen gas is dissolved in blood at higher atmospheric pressure
- Alveolar pressures increase to meet atmospheric pressure
- On returning to surface, atmospheric pressure normalizes
- Inhaled gases will expand, requiring diver to release gases on rising
- Nitrogen gas comes out of solution and forms bubbles within blood (may embolize)
- High Altitude (lower atmospheric pressure)
- See High Altitude Sickness
- Acclimitization occurs over weeks to months with neovascularization and increased RBC production
- At altitude, atmospheric pressure falls (523 mmHg at 10,000 feet, 349 mmHg at 20,000 feet)
- Alveolar pressure is limited to atmospheric pressure
- Water vapor (47 mmHg), CO2 (16-28 mmHg) and Nitrogen account for most alveolar pressure
- Remaining alveolar pressure for oxygen (pO2) is far less at altitude
- Diving (higher atmospheric pressure)
- Exercise
VI. Physiology: Lung Compliance
- Lung Compliance is the increase in Lung Volume per change in alveolar pressure
- Lung Compliance is high when small changes in alveolar pressure result in large changes in Lung Volume
- Causes
- Lung Compliance is decreased by pulmonary fibrosis, Pulmonary Edema or airway obstruction
- Chest wall deformity (e.g. Scoliosis) also decreases Lung Compliance
- Lung Elastance is the increase in alveolar pressure per change in Lung Volume (reciprocal of Lung Compliance)
- Lung elasticity is the tendency of lung to spring back into its resting state volume
- Lung elastance is high when small changes in alveolar volume result in large changes in alveolar pressure
- Causes
- Conditions that decrease Lung Compliance (e.g. pulmonary fibrosis, Scoliosis), increase lung elastance
- Increased alveolar surface tension resists expansion and is a key contributor to increased lung elastance
- Alveolar collapse (Atelectasis) occurs when alveolar surface tension is high
- Alveolar surfactant normally reduces alveolar surface tension and lung elasticity
- Alveolar surfactant is lacking in Respiratory Distress Syndrome in the Newborn and ARDS
- Manifestations
- Increased elasticity results in decreased Tidal Volume
- Compensation is with increased Respiratory Rate (Tachypnea)
VII. Physiology: Respiratory Bellows and Respiration Muscle Activity
- Background
- Respiratory Bellows (pump) allows for active expansion of Lung Volume by creating negative intrathoracic pressure
- Lung expansion decreases alveolar Gas Pressures, drawing in atmospheric gas from pharynx to alveoli
- Lung's power supply resides primarily in the diaphragm, and secondarily in the chest and neck accessory Muscles
- Resting position of the lungs is a balance between tendency for lung recoil inward and chest wall recoil outward
- Early inspiration is aided by the chest wall tendency for outward recoil
- Respiratory workload increases on full inspiration to counter the lungs inner recoil and chest wall stiffness
- Respiratory Bellows have significant reserve capacity
- Resting Minute Ventilation of 6 L/min in a typical adult male
- Minute Ventilation may increase to >100 L/min as needed (e.g. Exercise)
- Inspiration
- Diaphragm (core Muscle of inspiration)
- Moves downward on contraction, increasing negative pressure within the chest
- Accessory Muscles of inspiration
- Background
- Accessory Muscles draw the ribs upward and forward
- Changes the chest shape (in cross section) from eliptical to circular
- Pectoralis major
- Pectoralis minor
- Serratus Anterior
- Sternocleidomastoid Muscle
- Scalene Muscles
- Levatores Costarum Muscles
- Serratus posterior superior Muscle
- Background
- Diaphragm (core Muscle of inspiration)
- Expiration
- Passive relaxation of the chest assumes expired position (core expiratory function)
- Lungs passively recoil inward
- Chest wall will also relax and collapse inward to resting position after a full inspiration
- Lung Volumes decrease and alveolar Gas Pressure increases
- Gas flows from higher alveolar pressures to the lower pressures in pharynx
- Lungs passively recoil inward
- Accessory Muscles of expiration
- Background
- Triggers for accessory expiratory Muscle use
- Coughing
- Forced expiration toward Residual Volume
- Exercise
- Obstructive Lung Disease (Asthma, COPD) with incomplete expiration
- External intercostal Muscle
- Internal intercostal Muscle
- Transversus thoracis Muscle
- External oblique Muscle
- Internal oblique Muscle
- Transversus abdominis Muscle
- Passive relaxation of the chest assumes expired position (core expiratory function)
VIII. Anatomy: Images
-
 Lewis (1918) Gray's Anatomy 20th ed (in public domain at Yahoo or BartleBy)
-
 Lewis (1918) Gray's Anatomy 20th ed (in public domain at Yahoo or BartleBy)
-
 Lewis (1918) Gray's Anatomy 20th ed (in public domain at Yahoo or BartleBy)
-
 Lewis (1918) Gray's Anatomy 20th ed (in public domain at Yahoo or BartleBy)
-
 Lewis (1918) Gray's Anatomy 20th ed (in public domain at Yahoo or BartleBy)
-
 Lewis (1918) Gray's Anatomy 20th ed (in public domain at Yahoo or BartleBy)


IX. References
- Davies (1986) Acute Respiratory Failure, Cyberlog
- Goldberg (2014) Clinical Physiology, Medmaster, Miami, p. 51-9
- Guyton and Hall (2006) Medical Physiology, Elsevier Saunders, Philadelphia, p. 471-82, 514-23