
II. Technique: Transducer and Patient Positioning
- Patient Position
- Left lateral decubitus position may be optimal
- Consider with the left arm stretched overhead
- Brief breath holding may optimize some views
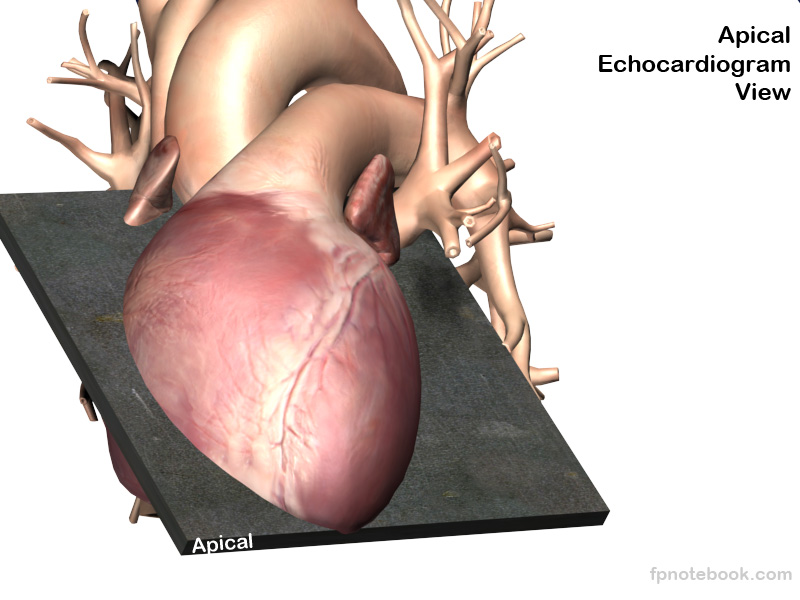
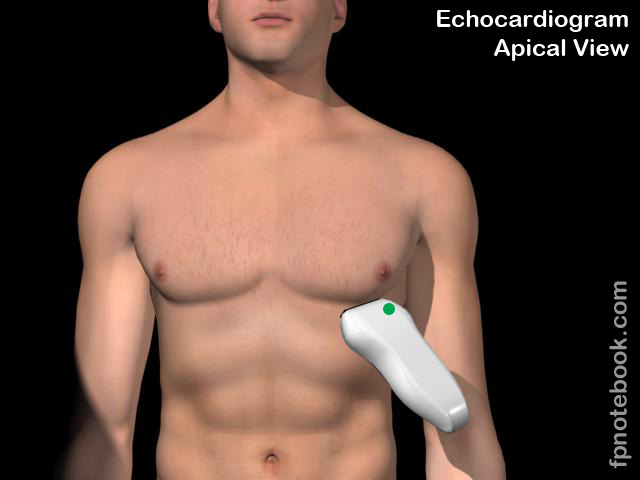
- Transducer orientation: 4 chamber apical view
- Transducer placed at PMI or approximately xiphoid level (6th intercostal space) in mid-clavicular line or nipple line
- Identify heart apex with other views (e.g. PLAX)
- Transducer indicator pointed towards patient's left (3:00 position)
- Align energy toward right Shoulder along heart's long axis
- Hand holding transducer is pushed with knuckles into the bed to get best angle through heart
- Four chamber apical view will appear bullet shaped, oriented vertically
- Alternative method to identify apical position
- Start in PSAX View and slide the probe to the point of maximal impulse, directed cephalad
- Transducer orientation: 5 chamber apical view
- From 4 chamber view, angle the transducer slightly anterior toward the chest wall (decreased angle to the chest)
- Transducer orientation: 2 chamber apical view

- Fron 5 chamber view, rotate the probe toward 1:00 position toward left Shoulder
- Transducer orientation: 3 chamber apical view
- Fron 2 chamber view, rotate the probe toward 11:00 position toward right Shoulder
- Images
III. Technique: Landmarks
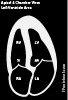
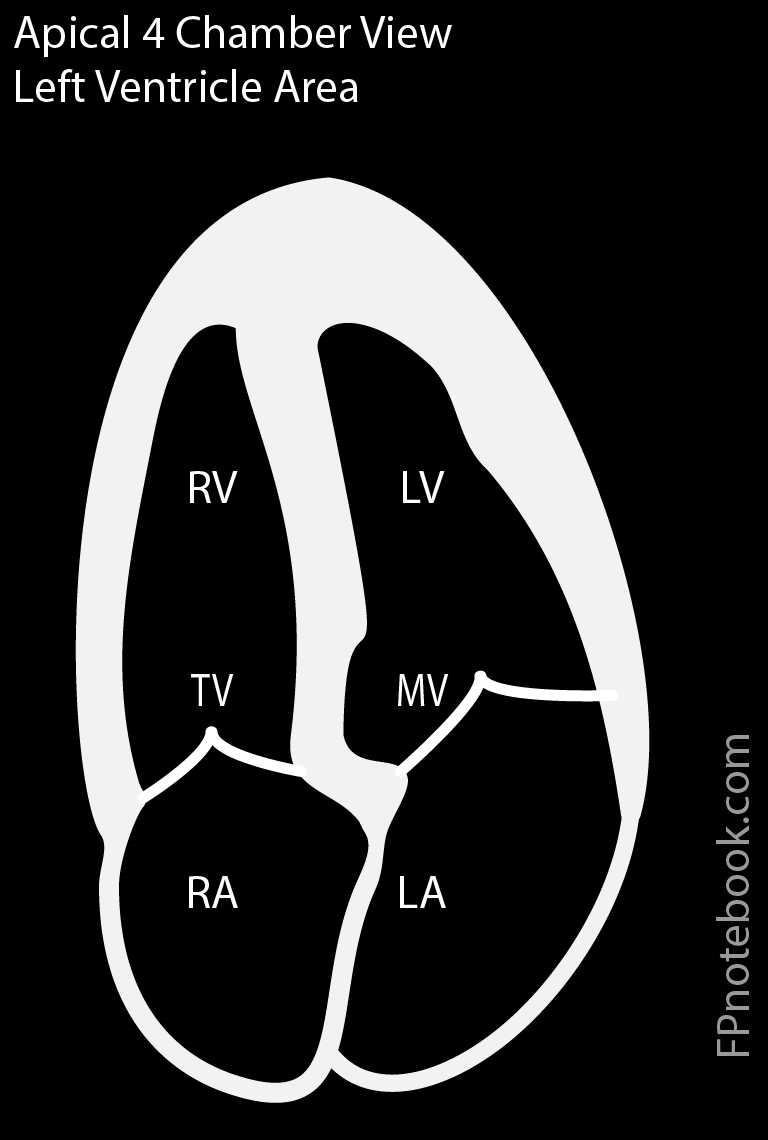
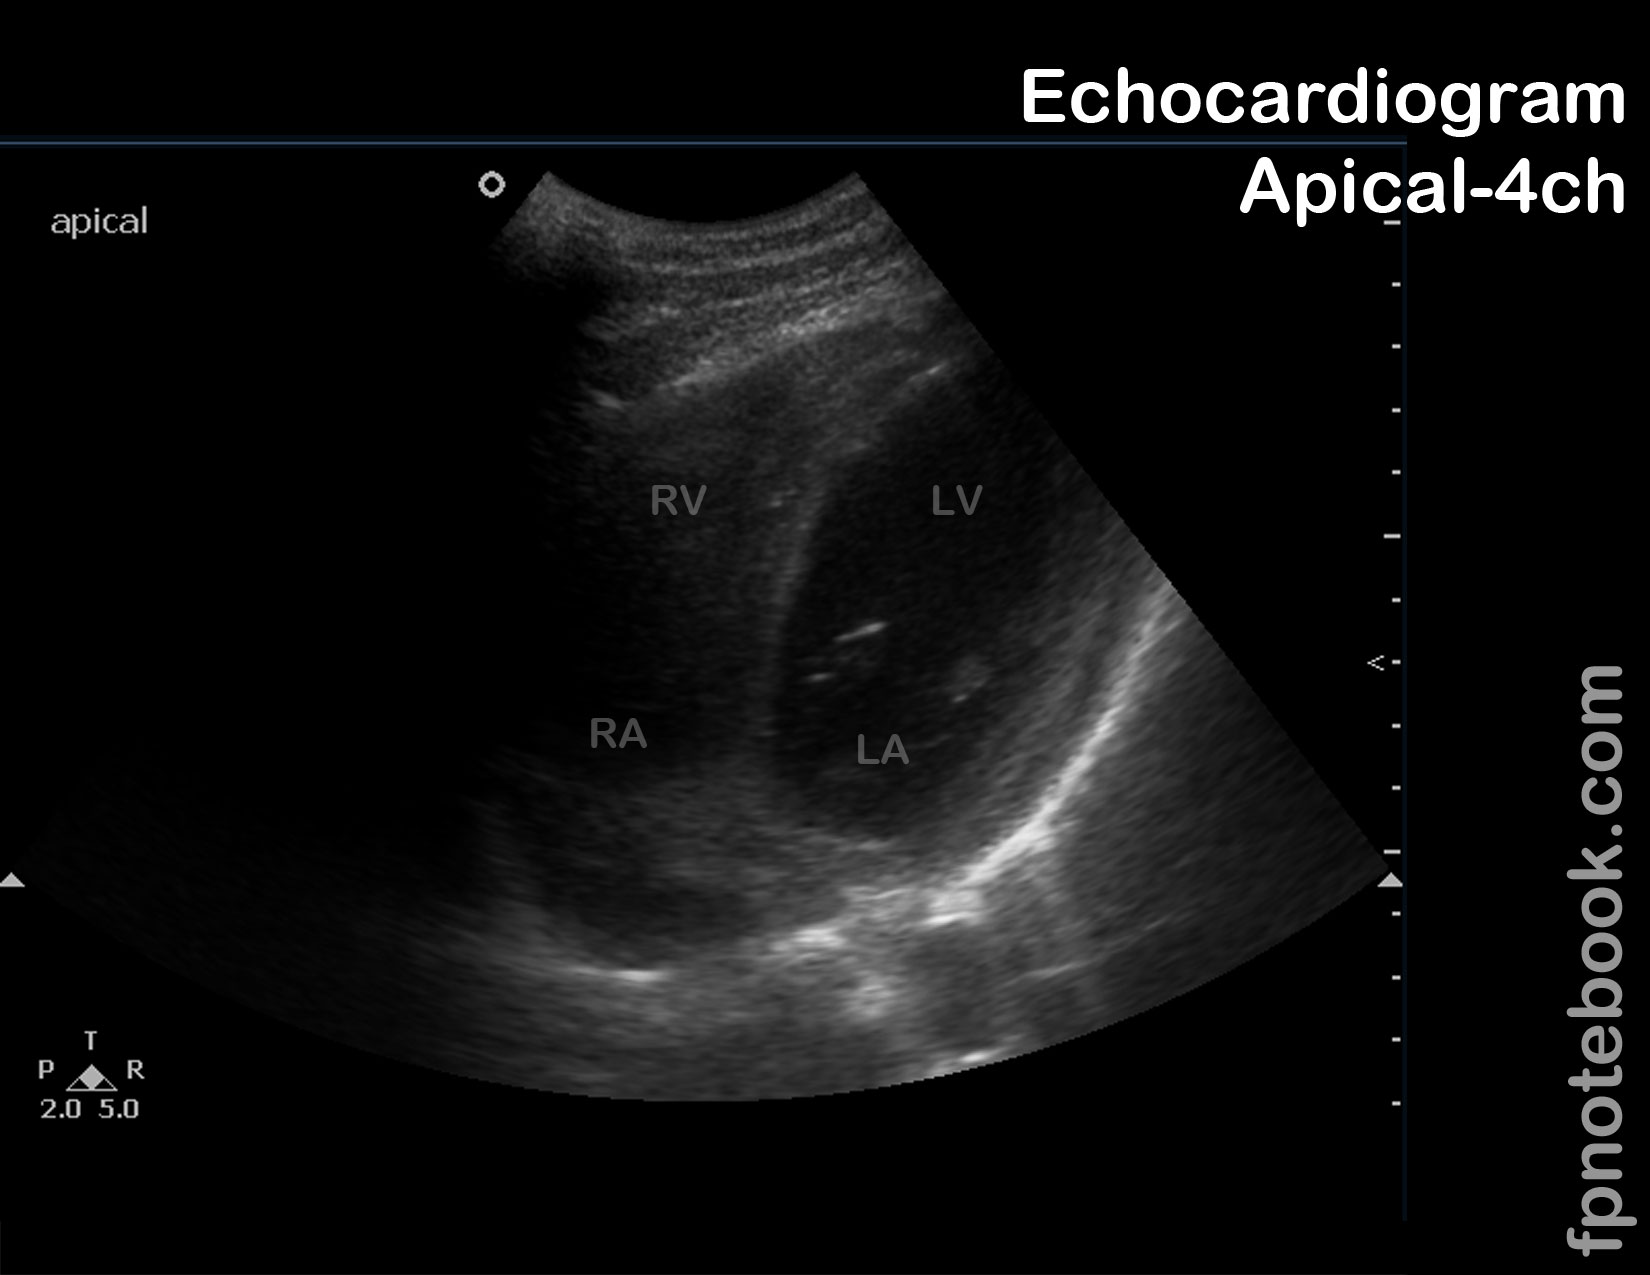
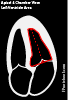
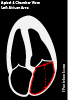
- Apical 4 Chamber View
- Right ventricle
- Triangular appearance
- Does not extend to the apex (unless the heart is foreshortened due to an inadequate view)
- Left ventricle
- View should show apex
- Tricuspid valve
- Appears higher on the screen, closer to probe, more inferior in chest
- Mitral valve
- Trace regurgitation is common
- Right atrium, left atrium
- Pulmonary veins and descending aorta
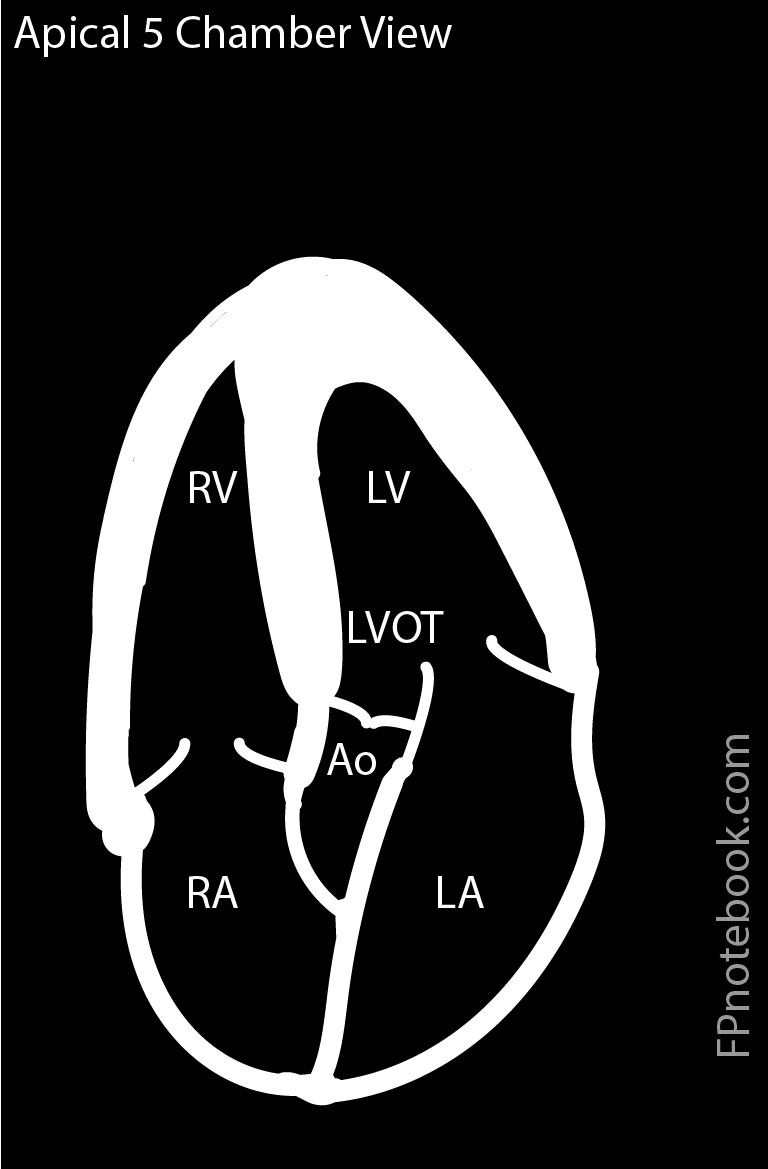
- Apical 5 Chamber View
- Similar to 4 chamber, but aortic outflow, aortic valve and aortic root appear between right and left atrium
- Right ventricle, intraventricular septum and Left ventricle
- Tricuspid valve and Mitral valve
- Right atrium, aortic outflow, aortic valve, aortic root and left atrium
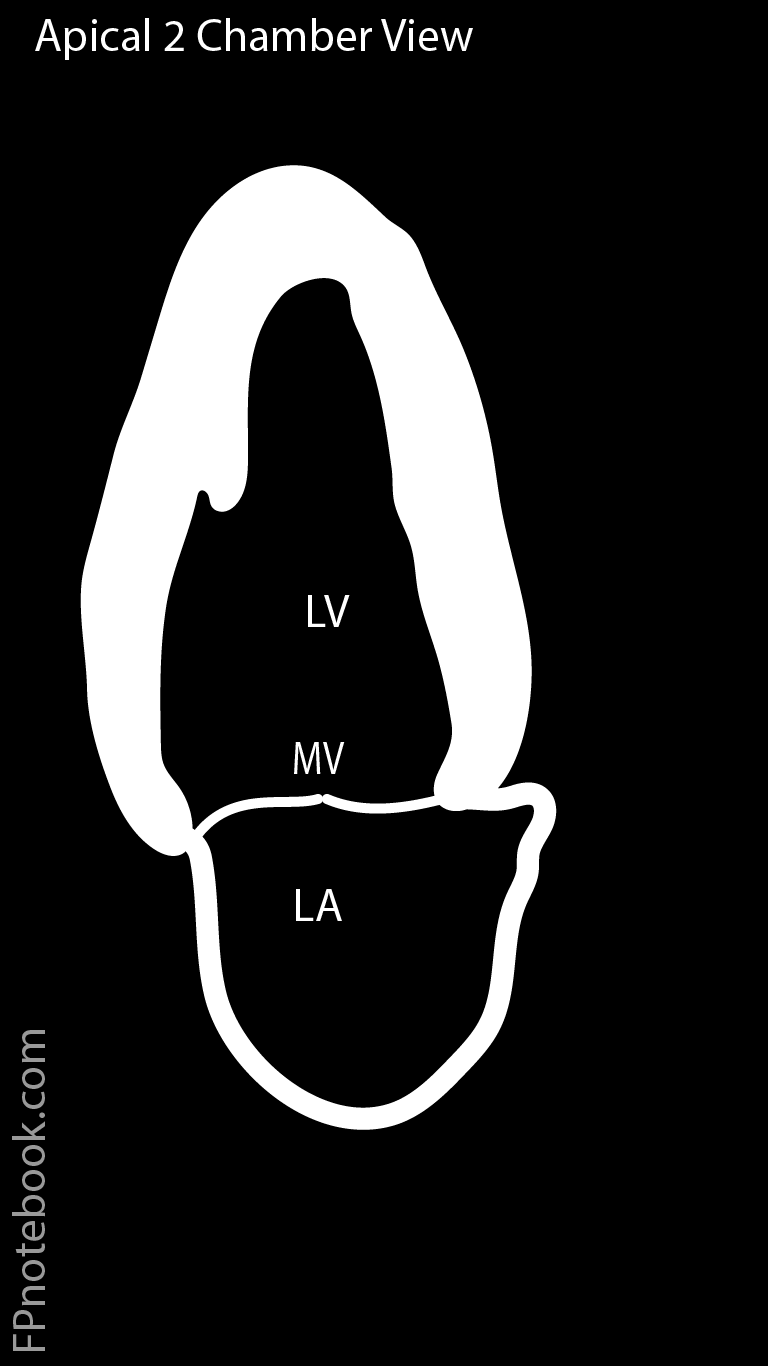
- Apical 2 Chamber View
- Apex
- Left ventricle
- Mitral Valve
- Left Atrium and left atrial appendage
- Apical 3 Chamber View
- Similar to standard PLAX View, but the orientation is rotated 90 degrees to vertical on screen
- Left Ventricle, Intraventricular Septum and Right Ventricular Outflow Tract
- Left Atrium, left ventricular outflow tract and aorta
IV. Interpretation: General
- Approach
- Pericardial Effusion (best view for Pericardiocentesis)
- Apical thrombus (decrease depth to see, apex is closest to probe in this location)
- Systolic Dysfunction
- Wall motion abnormalities
- Measurements: 2D
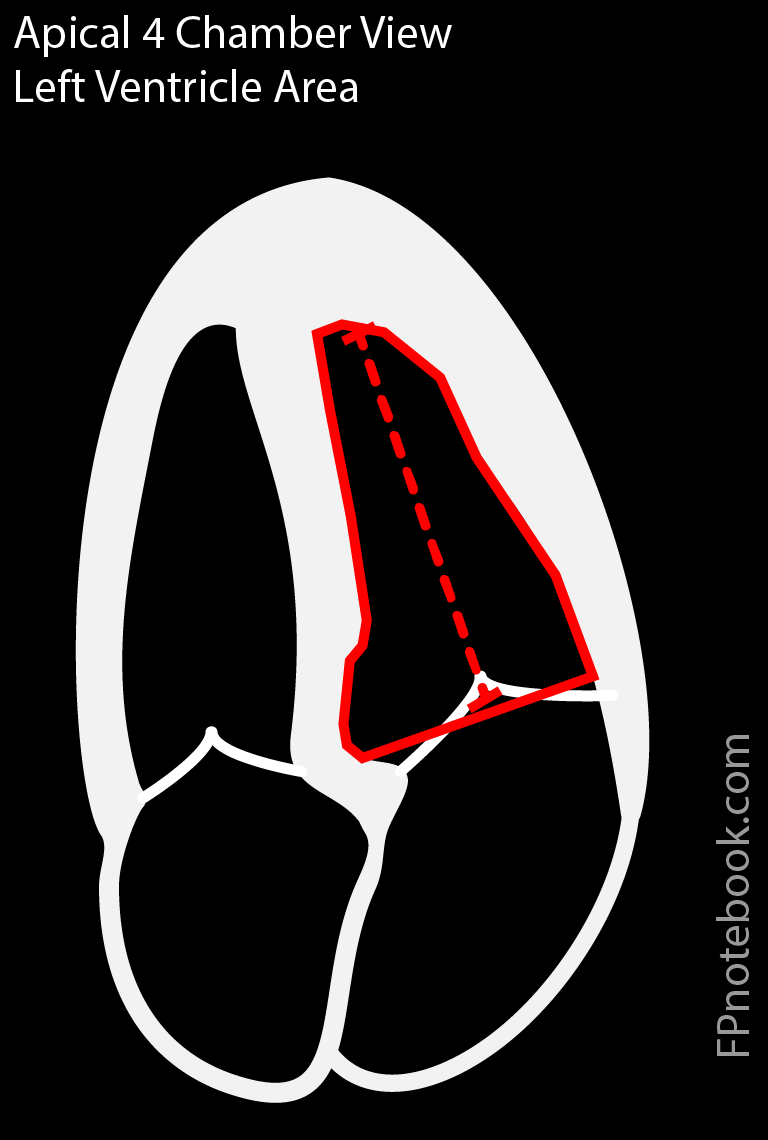
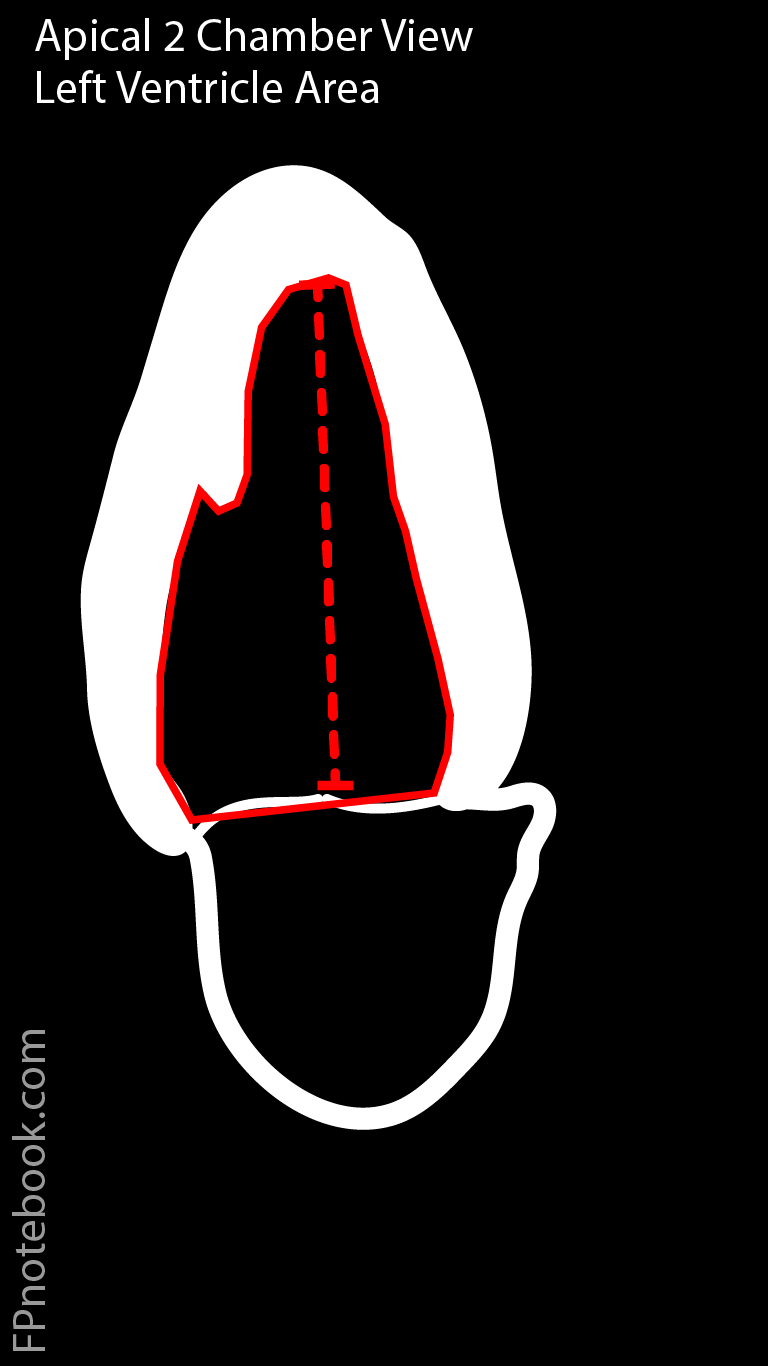
- Left Ventricular Function (Ejection Fraction) by biplane (simpson method of discs)

- Trace left ventricular volume (mid-mitral annulus to apex) at end-diastole and end-systole in 4 chamber view
- Trace left ventricular volume (mid-mitral annulus to apex) at end-diastole and end-systole in 2 chamber view
- Ventricular length should be similar between the 4 chamber and 2 chamber views
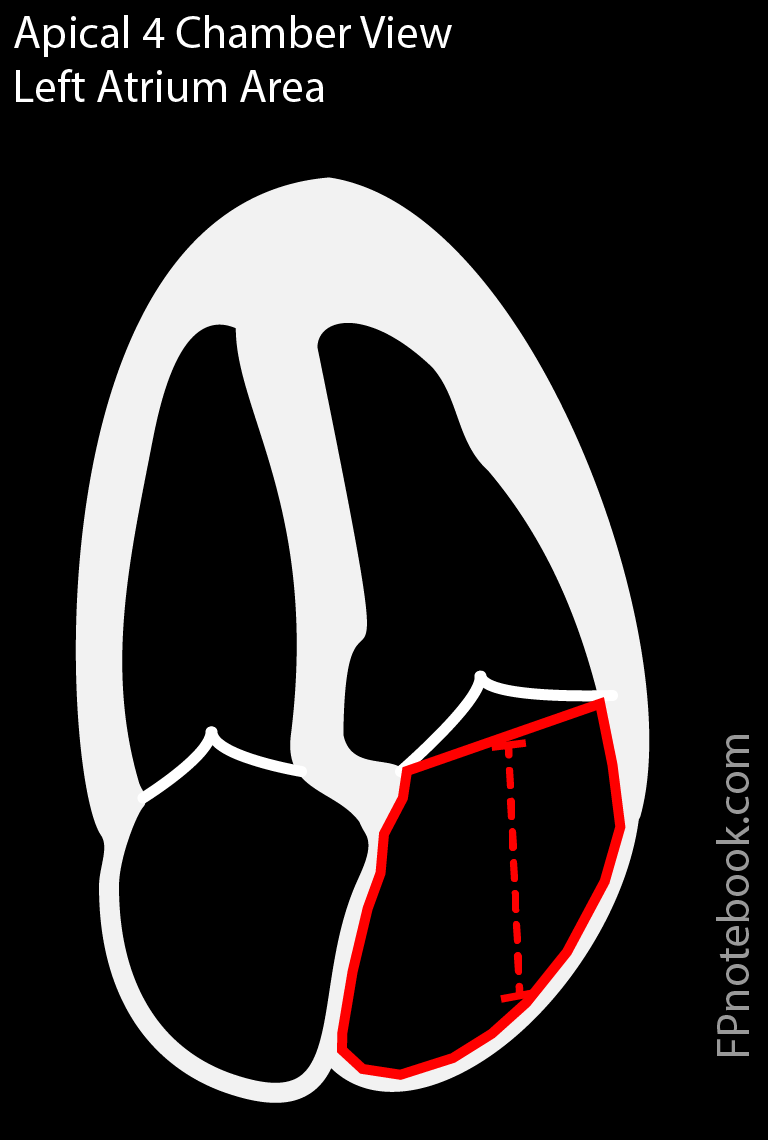
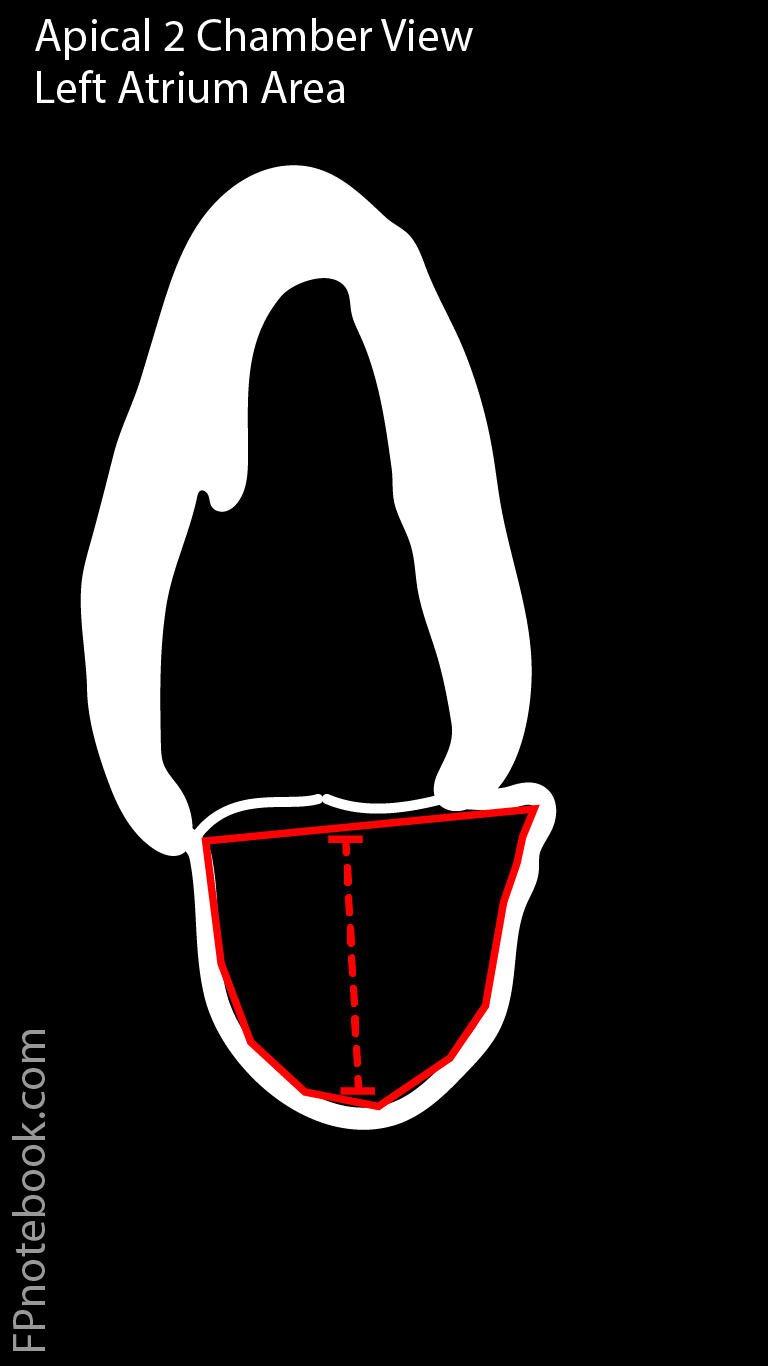
- Left Atrial Dimensions

- Measure at end-systole in both 4 chamber and 2 chamber views
- Normal <34 ml/m2
- Increased (left atrial enlargement) in Hypertension, Mitral Stenosis, Mitral Regurgitation, left Diastolic Dysfunction
- Left Ventricular Function (Ejection Fraction) by biplane (simpson method of discs)
- Measurements: Doppler
- Mitral Valve (4 chamber view)
- Color: Maximal jets, eccentric jets, multiple jets
- Pulse Wave Doppler: Mitral Valve E and A Waves (with cursor at mitral valve leaflets)
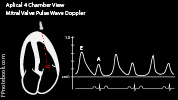
- Characteristic Biphasic M-Configuration
- Waves are upright (toward transducer)
- Continuous Wave Doppler: Mitral Regurgitation Jet velocities (trace wave)
- Normal mitral valve peak velocity 0.6 to 1.3 m/s
- Mitral Regurgitation will appear as negative wave (away from transducer) during systole
- Mitral Stenosis will show a flattened/notched appearance to the E and A waves during diastolic filling
- Mitral Valve Area by Pressure Half-Time (PHT) for native valves
- Optimize the Continuous Wave Doppler at mitral valve inflow
- Trace the mitral valve E Wave slope
- Machine will calculate the PHT, the time at which pressure has dropped 50%
- MVA (in cm2) = 220/PHT
- Normal MVA >= 2 cm2
- Severe Mitral Stenosis MVA <1 cm2 (>10 mmHg mean pressure gradient)
- Tricuspid Valve (4 chamber view)
- Similar to Mitral Valve pulse wave doppler appearance (biphasic M configuration)
- Similar to Mitral Valve Continuous Wave Doppler appearance
- Normal tricuspid valve peak velocity 0.3 to 0.7 m/s
- Tricuspid stenosis will show a flattened, downward sloping E to A during diastolic filling
- Tricuspid regurgitation will appear as negative wave (away from transducer) during systole
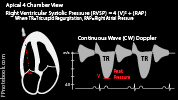
- Right Ventricular Systolic Pressure (RVSP) Measurement
- Even trace tricuspid regurgitation may be used to calculate right ventricular systolic pressure
- Measure tricuspid regurgitation peak velocity (TRPV or TRV, m/s) with Continuous Wave Doppler
- Typical tricuspid peak velocity = 2.5 m/s
- Estimate Right Atrial Pressure (RAP) based on inferior vena cava (IVC)
- RAP 3 mmHg: IVC <2.1 cm and collapses >50% on inspiration
- RAP 8 mmHg: IVC <2.1 cm (~3 mmHg) and collapses <50% on inspiration
- RAP 15 mmHg: IVC >2.1 cm (~3 mmHg) and collapses <50% on inspiration
- Right ventricular systolic pressure (RVSP in mmHg) = 4 * TRPV^2 + RAP
- Tricuspid regurgitation pressure = 4 * TRPV^2 (based on Bernoulli Equation)
- RVSP also reflects pulmonary artery pressure except in RV outflow obstruction
- Normal right ventricle (and PA) peak systolic pressure = 15 to 25 mmHg
- Not accurate in Ventricular Septal Defect (VSD)
- However, RVSP can be measured in PLAX View across the VSD
- Measure the pressure gradient peak velocity across the VSD (Vvsd)
- RVSP = BPsys - 4 * (Vvsd)^2
- Not accurate in Patent Ductus Arteriosus (PDA)
- However, RVSP or PASP can be measured in PSAX-Aorta
- Measure at the level of the PDA within the pulmonary artery
- PASP (or RVSP) = BPsys - 4 * (Vpda)^2
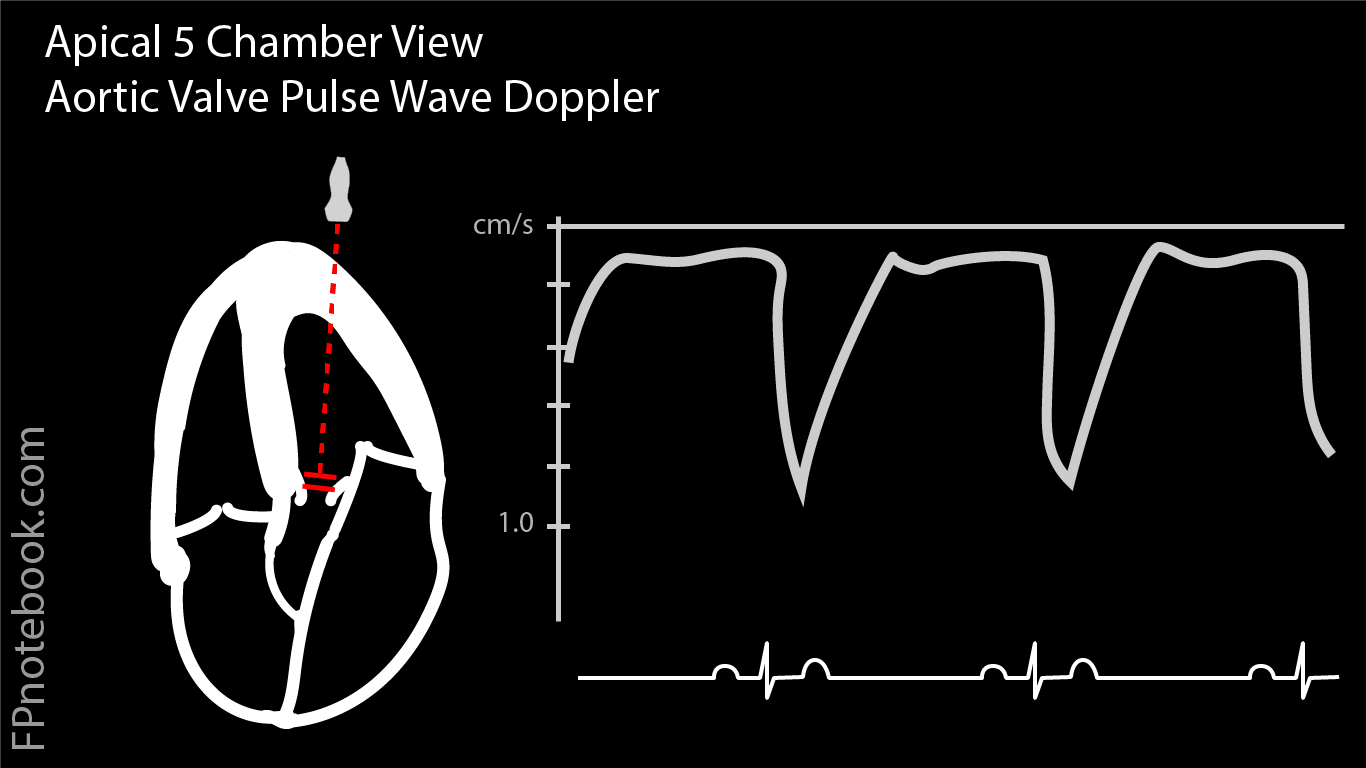
- LVOT and Aortic Valve (5 chamber view)
- Flow away from the transducer (negative deflection)
- Normal aortic peak velocity: 1.0 to 1.7 m/s
- Continuous Wave Doppler
- Aortic Regurgitation will result in positive deflections (toward transducer)
- Aortic Stenosis will result in negative deflections (away from transducer)
- Pulse Wave Doppler
- Precaution
- Aortic Stenosis jet and Mitral Regurgitation jet may be confused for one another
- Mitral Valve (4 chamber view)


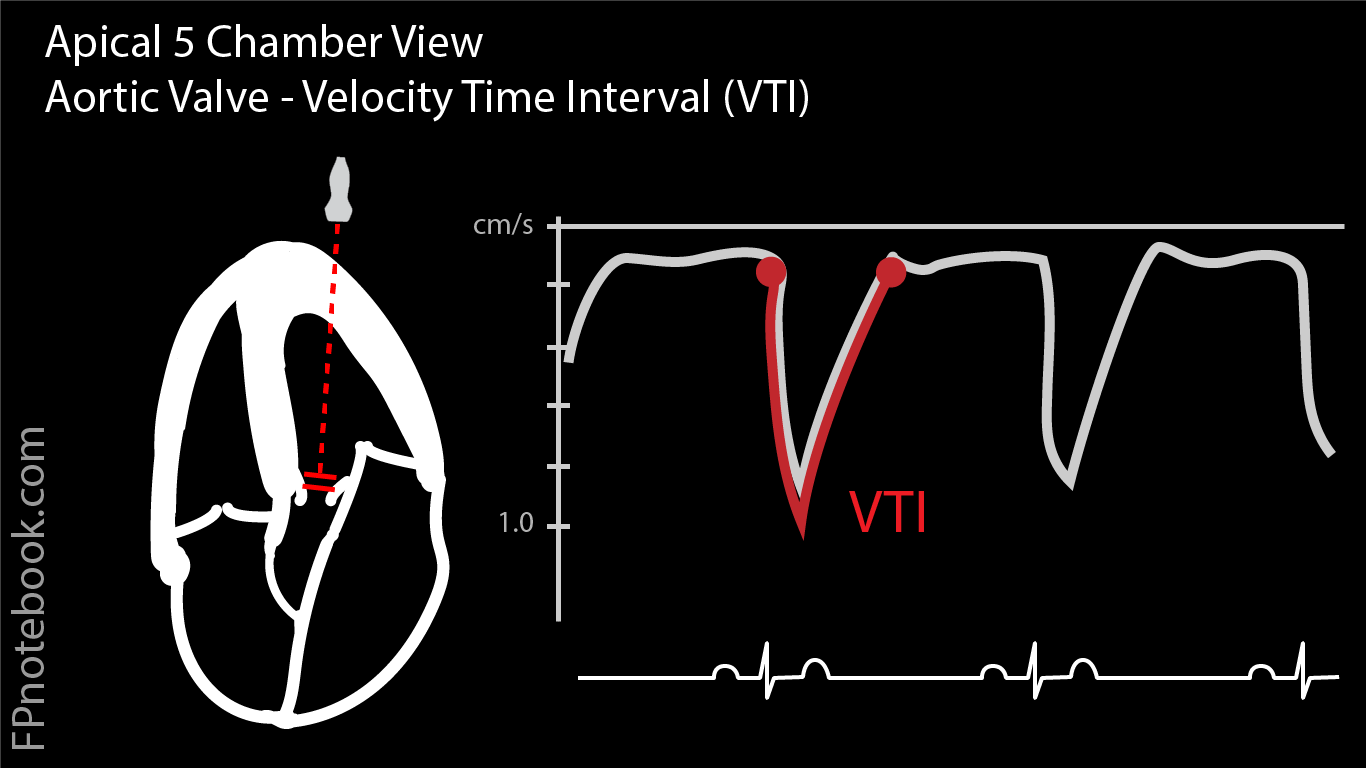
V. Interpretation: Stroke Volume (Velocity-Time Integral or VTI)
- Precautions
- Inaccurate in moderate to severe Aortic Regurgitation or dynamic LVOT obstruction
- View: Apical 5 Chamber View
- Start with 4 chamber apical view (see above)
- Angle the transducer slightly anterior toward the chest wall
- Measurement of Velocity-Time Integral (VTI) of the Left ventricular outflow tract (LVOT)
- Set Ultrasound machine to Pulse Wave doppler (PWD)
- Place cursor in Left ventricular outflow tract (LVOT)
- Place cursor as close to aortic valve without including it
- Capture Pulse Wave doppler (PWD) wave form and freeze the image
- PWD wave form will appear as a sharks fin
- Measure the area under the curve of the PWD wave form (LVOT VTI)
- Choose LVOT VTI from the Ultrasound calculation menu
- Manually trace the wave with the cursor
- Machine calculates the area under the curve (VTI in cm)
- Interpretation of Velocity-Time Integral (VTI in cm)
- Normal adult VTI = 18 to 22 cm (when Heart Rate 55 to 95 beats/min)
- References
VI. Interpretation: Fluid responsiveness based on Velocity-Time Integral (VTI in cm)
- Technique
- Obtain initial VTI measurement (as above)
- Perform Passive Leg Raise Maneuver (PLR Maneuver)
- Repeat VTI measurement (as above)
- Interpretation
- Increase in Velocity-Time Integral (VTI in cm) of 15% with passsive leg raise suggests fluid responsive
- References
VII. Resources
- Apical 4-Chamber View Video (SonoSite)
- Echocardiographer
VIII. References
- Jordan (2019) Cardiac Ultrasound Protocol Manual, Gulfcoast Ultrasound, p 13-22
- Reynolds (2018) The Echocardiographer's Pocket Reference, Arizona Heart Association, p. 323-4
- Palma, Bourque and Jordan (2019) Introduction to Adult Echo Ultrasound Conference, GulfCoast Ultrasound, St. Petersburg
- Mateer and Jorgensen (2012) Introduction and Advanced Emergency Medicine Ultrasound Conference, GulfCoast Ultrasound, St. Pete's Beach
- Noble (2011) Emergency and Critical CareUltrasound, Cambridge University Press, New York, p. 61-88
- Orman, Dawson and Mallin in Majoewsky (2013) EM:Rap 13(1): 4-6
- Reardon (2011) Pocket Atlas Emergency Ultrasound, McGraw Hill, New York, p. 61-106
- Stowell, Kessler and Lotz (2017) Crit Dec Emerg Med 31(8): 13-22