
II. Indications
III. Preparation
- Patient should avoid loud noise exposure for 14 hours prior to testing (e.g. music via headphones, motorcycle)
- Testing environment should be quiet
- Formal audiology evaluations are typically performed in a sound proof booth
- Testing varies by indication
- Clinic Hearing screening is often performed with a handheld device (or online/webapp)
- Threshold search Audiometry may be used to program Hearing Aids
- Comprehensive Audiometry differentiates between conductive, sensorineural and mixed Hearing Loss
IV. Technique: Pure-Tone Audiometry
- Screening (typical handheld device)
- Hearing frequencies tested: 500 to 4000 Hz (speech spectrum)
- Loudness tested: 25-30 DB in adults (15-20 DB in children)
- Threshold Search Audiometry (Hughson-Westlake Method, by audiologist)
- Start with the better Hearing ear
- Hearing is tested in each ear at frequencies between 250 Hz to 8000 Hz
- Frequencies tested at one octave intervals: 250 Hz, 500 Hz, 1000 Hz, 2000 Hz, 4000 Hz, 8000 Hz
- Typical sequence: 1k, 2k, 3k, 4k, 8k, 1k, 500, 250
- Each frequency is tested at volumes between 0-90 decibels (logarithmic, loudness doubles every 10 decibels)
- Start with an easily heard DB level
- Test each heard tone again at 10 DB lower until no response
- Then increase by 5 DB, testing until tone heard again
- Comprehensive Audiometry (by audiologist, typically in a sound proof room)
- Air and bone testing differentiates conductive, sensorineural and mixed Hearing Loss
- Pure tone air conduction via headphones
- Pure tone bone conduction via device applied to mastoid bone
- Tympanometry
- Speech-reception threshold and word recognition
- Air and bone testing differentiates conductive, sensorineural and mixed Hearing Loss
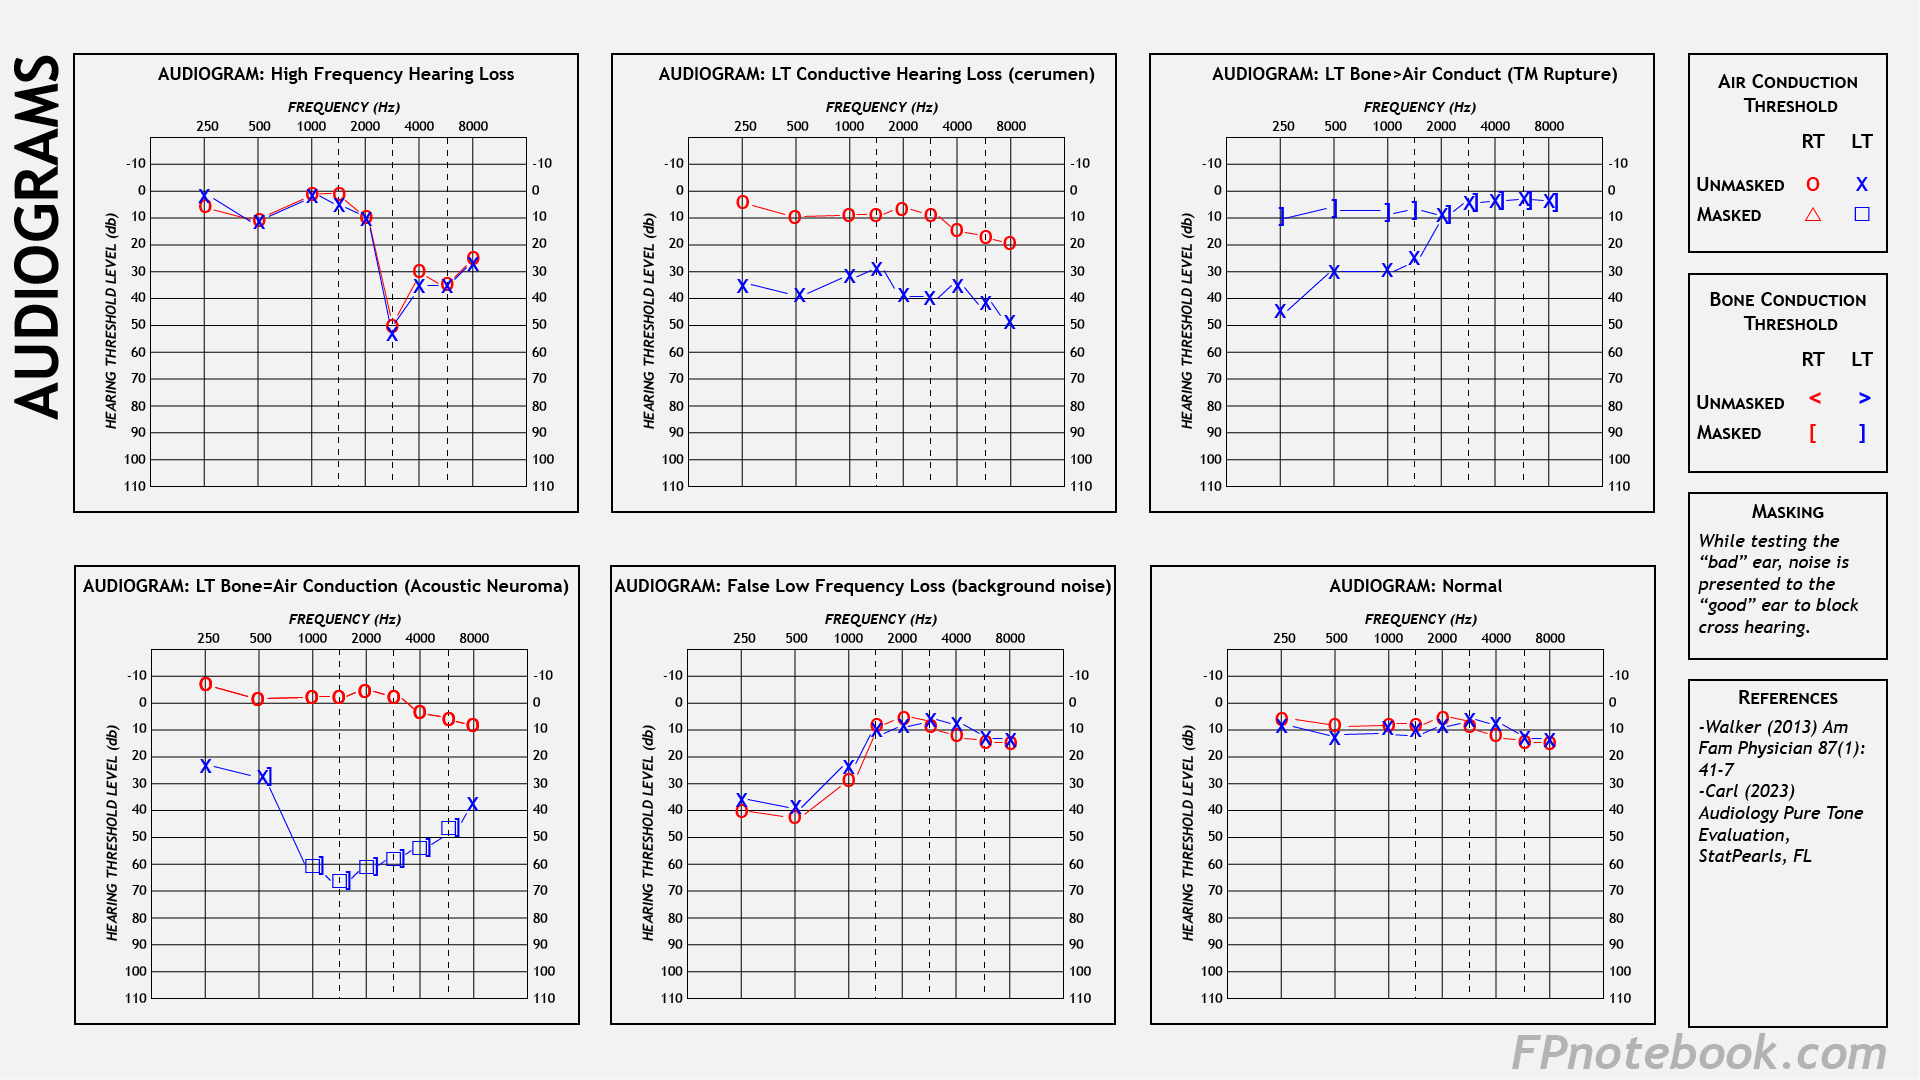
V. Findings: Audiogram Graph
- Images
- Audiogram axes
- Horizontal (X-Axis): Increasing frequencies (Hertz) from left to right
- Vertical (Y-Axis): Increasing sound intensity (decibels) from soft (top) to loud (bottom)
- Thresholds
- Softest sound heard per frequency 50% of the time is recorded as threshold on the graph
- Symbols
- Four symbols are used (2 for air L/R, 2 for bone L/R)
- For each frequency, these 4 symbols are plotted, representing thresholds (left and right ears, air and bone)
- Interaural Attenuation
- Sound waves lose acoustic energy as they travel transcranially to the contralateral ear
- In Hearing Testing, soft sounds are not typically heard by the opposite ear
- Cross Hearing
- Good ear detects sounds presented only to the bad ear despite interaural attenuation
- Results in False Negative testing of the bad ear
- Overcome by masking procedure
- Cross Hearing occurs when there is a large threshold discrepancy between ear Hearing thresholds
- Bad ear threshold exceeds the good ear threshold by >40 dB (55 dB for insert earphones)
- Loud sounds presented to bad ear overcomes interaural attenuation
- Good ear detects sounds presented only to the bad ear despite interaural attenuation
- Masking
- When testing the "bad" ear, noise is presented to the "good" ear to block cross Hearing
VI. Interpretation
- Normal Hearing
- All frequencies are heard at 20 decibels or less
- Hearing Loss across all frequencies (typically 40 DB loss)
- Low frequency Hearing Loss
- Meniere's Disease (severe)
- Low to mid-frequency Hearing Loss (with bone conduction better than air conduction)
- High frequency Hearing Loss
- Noise-Induced Sensorineural Hearing Loss (4000 Hz and higher)
- Age-Related Hearing Loss - Presbycusis (2000 Hz and higher)
VII. Efficacy: Handheld Audiometry for Sensorineural Hearing Loss (over age 5 years)
- Test Sensitivity: 92%
- Test Specificity: 94%